


Written by: Bryan Grobstein, Vice President, Global Revenue, AnyRoad
Key Takeaways
- Ambassador tasting revenue impact means incremental sales above baseline, because pantry-loading and pull-forward demand inflate same-day numbers.
- Incremental revenue comes from a matched baseline, a difference-in-differences calculation, and a 30–90 day tracking window that separates real lift from noise.
- Receipt-verified purchase tracking replaces depletion reports by linking a specific tasting to a verified bottle purchase without POS integration.
- Fully loaded ambassador costs, including labor, samples, materials, travel, and management, belong in the ROI denominator for a defensible figure.
- AnyRoad provides the receipt-verified conversion and loyalty tools in this playbook that connect tastings to actual purchases without retailer integration.
See how AnyRoad measures real tasting ROI.

Step 1: Separate Event-Day Sales From Incremental Revenue From Ambassador Tastings
Event-day sales are the most visible output of an ambassador tasting, but a CFO or chain buyer will not accept them as proof of program value. A spike on the day of the tasting captures pantry-loading, pull-forward demand, and category-wide momentum, which the tasting did not cause. The number that survives scrutiny is incremental revenue from tastings, or what the account sold above what it would have sold anyway.
Three formulas structure the calculation, each building on the last: revenue lift first, then the profit that lift produces, then the return that profit delivers against cost.
- Incremental revenue per tasting = (event-day sales − matched baseline sales) × number of tastings
- Incremental gross profit = incremental revenue × margin
- Ambassador tasting ROI = (incremental gross profit − tasting cost) ÷ tasting cost
This output is a defensible estimate, not a causal proof. Its credibility depends on the quality of the baseline constructed in Step 2 and the tracking window defined in Step 4. The credibility of that output rests on the baseline, which is the subject of Step 2.
Step 2: How Do You Build A Matched Baseline For An Ambassador Tasting?
Baseline construction is the gap no competitor measurement framework fills completely. The six steps below go deeper than a standard ROI formula and explain how to isolate true incremental lift from noise.
- Define the treatment unit. Decide whether the tasting is measured at the store level, the day level, or the account level. A tasting inside a Total Wine is a store-level treatment. A tasting inside an on-premise account is an account-level treatment. Mixing levels produces an uninterpretable result.
- Build a matched baseline. Pair each tasting store or day with a non-tasting store or day of similar size, traffic, and demographics. Match on four variables: baseline unit velocity over the prior 8–12 weeks, store format and banner, pricing and promo depth, and local demographics. For premium, low-velocity products like wine and spirits, use the longer end of that pre-period, because a short window will not capture their slower baseline. Selecting control stores on sales volume alone is a critical mistake, and demographic and competitive context must also match.
- Run a difference-in-differences calculation. Incremental volume = (treatment post − treatment pre) − (control post − control pre). This strips out holidays, weather, and category-wide swings that would otherwise inflate the result.
- Set the tracking window at 30–90 days. Immediate depletion overstates impact because it captures pantry-loading and pull-forward, rather than new demand. Brands evaluating sampling ROI at the 7-day mark typically underreport actual ROI by 40–60%, because the first week captures only part of the total revenue impact.
- Track the lag in standardized intervals. Report performance across three windows: immediate lift (event days), short-term response (weeks 1–4), and long-term carryover (weeks 5–12). Report each separately so leadership understands the compounding nature of tasting value.
- Reconcile against a receipt-verified record where one exists. Baseline math tells you what the account sold. Only a receipt-verified record tells you which of those bottles came from your activation, a distinction covered in Step 5.
Step 3: Populate The Incremental Revenue Formula With Your Own Inputs
The worked ROI calculation is a framework the reader populates with their own data. Every input below is a variable the brand supplies, because a benchmark that does not match your margin, price point, or account mix will produce a misleading result.
To run the Step 1 formula, gather five inputs from your own records:
- Number of tastings run in the measurement period
- Bottles moved per tasting (incremental, above baseline)
- Net realized bottle price
- Gross margin per bottle
- Total ambassador cost per tasting (see Step 6 for the denominator)
Consider a simple arithmetic skeleton. If a brand runs 20 tastings, moves 12 incremental bottles per tasting at its own price and margin, and knows its own ambassador cost per tasting, it can populate the formula from Step 1 directly. The output, incremental gross profit minus tasting cost, divided by tasting cost, is the ROI figure that belongs in a QBR deck. That figure is only as good as the baseline from Step 2 and the window from Step 4.
Step 4: Track Sales For 30–90 Days After Each Tasting
Track tasting impact for 30–90 days, using standardized intervals. Purchase decisions for premium spirits and wine often lag the tasting event by days or weeks, and a short window captures pantry-loading rather than new demand. Only 40–50% of total attributable sampling revenue arrives in days 1–7, another 25–30% arrives in days 8–30, and the final 20–30% arrives in days 31–90, so roughly half of attributable revenue lands after the first week.
For premium, specialty, or low-velocity products with longer consideration cycles, analysts should establish a pre-period of eight to twelve weeks, a relevant distinction for wine and spirits, which typically fall in that category. A 7-day read is a partial snapshot that systematically understates the eventual revenue impact.
Step 5: Use Receipt-Verified Conversion Instead Of Depletion Reports
The depletion report is an obsolete unit of proof for ambassador tastings. It records what left a distributor's warehouse, while saying nothing about what a specific consumer bought after attending a specific tasting. It cannot connect an activation to a bottle actually sold, and it cannot survive the question a chain buyer or CFO will ask about which depletions the tasting caused.
Receipt-verified purchase tracking provides a stronger alternative. AnyRoad's Purchase Conversion tools and Lifetime Loyalty suite connect an ambassador tasting to a receipt-verified bottle purchase without a POS integration. The mechanic works as follows:

- Guests register on the spot via the AnyRoad Live mobile app by scanning a QR code at the tasting.
- They receive an SMS with a cashback rebate redeemable anywhere the product is sold.
- They buy the bottle, photograph the receipt, and text it back.
- AnyRoad's AI reads the receipt, confirms the eligible SKU, and pays the rebate via Venmo or PayPal.
- No POS integration is required, which makes the mechanic deployable across trade accounts at scale.
The same mechanic works on-premise, where a rebate tied to an identifiable SKU on a bar tab is measurable in a way a depletion report never is. Brands that cannot offer cash back can run the sweepstakes variant instead, which swaps the rebate for a prize entry, such as event tickets, and AnyRoad handles regulatory compliance including terms and conditions and privacy policies.
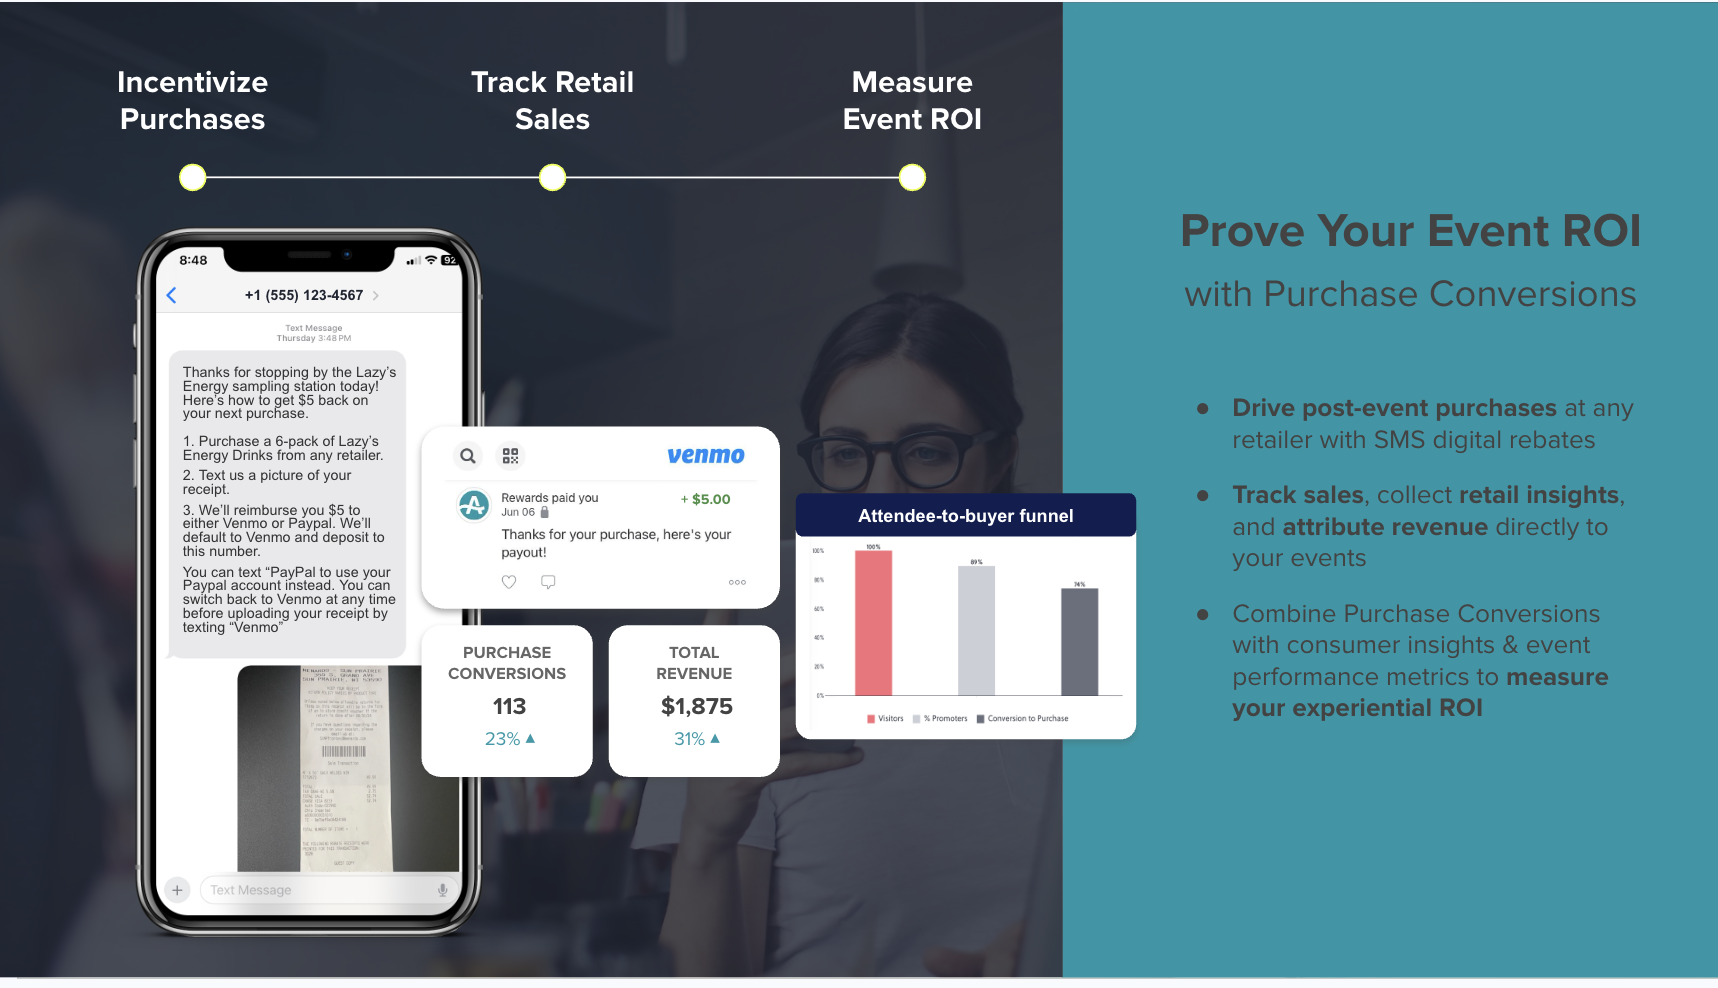
In a one-month pilot with a single unnamed craft brand, 56% of the records collected converted to a bottle purchase, a small-sample result that should not be read as a platform benchmark, but one that shows what becomes measurable once a depletion report is replaced with a receipt-verified record.
Turn receipt-verified purchases into a QBR-ready number.
Step 6: Calculate Fully Loaded Brand Ambassador Cost Per Tasting
Ambassador cost per tasting is the denominator that turns gross incremental sales into a defensible ROI figure. It must include every cost the tasting incurs, including the hourly rate and everything around it.
Every cost the tasting incurs belongs in the denominator, and four categories cover most of them:
- Labor: Brand ambassadors hired through a professional staffing agency typically cost $25–$75 per hour per ambassador, with rates varying by market, required credentials, and shift length. The sweet spot for most brand ambassador campaigns is a $35–$50 bill rate, covering a vetted ambassador with brand-specific training and management oversight.
- Samples and materials: Product poured, collateral distributed, and any branded table setup.
- Travel and logistics: Mileage, parking, or out-of-market accommodation where applicable.
- Management and coordination: On-site team lead time and agency coordination fees, which are generally bundled into the agency hourly rate rather than billed as separate line items.
A tasting that runs four hours with one ambassador at a $40 bill rate, plus $50 in samples and materials, carries a floor cost of $210 before travel. That $210 is the denominator the ROI formula requires, and any calculation that omits one of these components will overstate the return by exactly the amount left out.
Step 7: Acknowledge The Honest Limits Of Attribution
Single-source attribution for ambassador tastings remains unreliable, and the measurement playbook above does not change that reality. Two documented examples illustrate why.
A Glenfiddich tasting documented by the Beverage Information Group sold 13 bottles of premium expressions during a two-hour event against a 1–2 bottle baseline for the 12-year expression. The lift is real and measurable, but the depletion data cannot tell you whether the tasting caused every one of those 13 purchases or whether some buyers were already planning to buy that week, which is exactly the attribution limit this section is about.
Willamette Valley Vineyards' 2021 annual report (NASDAQ: WVVI) showed a 26.0% increase in revenue from direct sales, which the winery attributed primarily to an increase in direct-to-consumer sales. The honest qualifier is the important word. A program that contributed to 26% growth is a strong program. A program that claimed sole credit for 26% growth would be making an attribution claim the data cannot support.
Stating the correlation limit plainly in a QBR deck builds credibility, because it signals that the measurement methodology is rigorous.
Step 8: Present The Revenue Number To Leadership
A defensible revenue-per-tasting claim walking into a QBR or chain review includes four components: the baseline used and how it was constructed, the tracking window applied, the full ambassador cost included in the denominator, and the explicit caveats on causality. A claim without those components is a sales number dressed up as a measurement.
The caveats shrink when a receipt-verified record replaces the baseline estimate. The receipt-verified record from Step 5 is what moves the conversation from "we think the tasting drove these sales" to "here is the receipt that confirms it." That shift creates a number that survives a CFO's scrutiny.
Frequently Asked Questions
The questions below cover the points field and trade teams raise most often when they first apply this playbook.
How Do You Calculate Incremental Revenue From An Ambassador Tasting?
Use the Step 1 formula: event-day sales minus matched baseline sales, multiplied by the number of tastings. The baseline comes from the matched control group described in Step 2, and the accuracy of the output depends on the tracking window defined in Step 4.
What Is A Realistic Revenue Lift From A Tasting Program?
No universal benchmark applies across price points, channels, and brand sizes. Research shows that immediate event-day lift significantly overstates lasting impact, and that sustained lift measured four to twelve weeks post-event is the commercially meaningful number. Programs concentrated on a small number of high-velocity tier-one accounts consistently outperform programs spread thinly across many accounts. A $50,000 activation budget concentrated on 20 top accounts produces depletion lift a chain buyer can see; the same budget spread across 200 accounts produces no measurable lift anywhere.
How Long After A Tasting Should You Track Sales?
Track for 30–90 days in the three intervals described in Step 4. As noted there, a 7-day read captures only part of the total revenue impact, especially for premium spirits and wine with longer consideration cycles.
How Much Does A Brand Ambassador Cost Per Tasting?
The denominator is the fully loaded cost described in Step 6, which includes labor, samples, materials, travel, and management, rather than the hourly rate alone. Most professional staffing agencies bundle recruiting, vetting, training, and insurance into that hourly bill rate instead of itemizing them separately.
What Is The Difference Between An Ambassador Tasting And A Depletion Report?
A depletion report records what left a distributor's warehouse during a given period. It does not identify which consumer bought which bottle, whether a specific tasting caused a specific purchase, or whether the lift would have occurred without the activation. An ambassador tasting, measured properly with a matched baseline and a receipt-verified conversion mechanic, produces a first-party record tied to an identifiable consumer and an identifiable SKU. The depletion report is a lagging distribution metric, while receipt-verified conversion provides a stronger attribution record.
Can You Measure An Ambassador Tasting Without A POS Integration?
Yes. The mechanic in Step 5 runs entirely on the consumer's receipt photograph, so it works in any retail or on-premise account without retailer integration. The QR registration, SMS offer, receipt upload, and AI verification all occur outside the retailer's POS system.
Who Should Own Ambassador Tasting Measurement, Field Marketing Or Trade Marketing?
Both functions have a stake, but ownership should be assigned to one. Field marketing typically owns execution quality and ambassador performance. Trade marketing typically owns account-level velocity data and the chain buyer relationship. The measurement methodology described in this playbook, including matched baseline, difference-in-differences, a 30–90 day window, and receipt-verified conversion, requires data that spans both functions. In practice, the team that owns the QBR presentation should own the measurement process, with the other function supplying its data inputs on a defined cadence.
Conclusion: Build The Measurement Process Before The Next Tasting
The eight steps above reduce to five components: a matched-store baseline built on 8–12 weeks of pre-period data, a difference-in-differences calculation that strips out category noise, a 30–90 day tracking window reported in standardized intervals, a worked ROI framework populated with the brand's own inputs, and a receipt-verified conversion record that replaces the depletion report as the unit of proof.
None of these components requires a POS integration. The matched baseline requires distributor or retailer scan data and a control group. The receipt-verified record requires AnyRoad's Purchase Conversion tools and Lifetime Loyalty suite, which produce a first-party record tied to a receipt-verified purchase without asking a retailer to integrate anything.
The brands that walk into a chain review with a defensible incremental revenue number, baseline stated, window defined, ambassador cost included, and caveats explicit, are the brands that retain authorizations and grow trade budgets. The brands that walk in with a depletion report and an event-day sales figure are the ones that get asked to prove it next quarter.
Build your measurement process before the next tasting.