


Written by: Bryan Grobstein, Vice President, Global Revenue, AnyRoad
Key Takeaways
- Traditional depletion reports fail to connect specific tastings to specific purchases because they lack consumer-level data, a counterfactual baseline, and real-time feedback.
- Three complementary attribution methods (baseline lift analysis, direct capture tactics, and incrementality testing) help brands isolate tasting-driven sales without POS integration.
- Key performance metrics include conversion rate, cost per acquisition, incremental lift, redemption rate, and sustained lift over 30–60 days.
- Ambassador tenure and the multiplier effect, where store staff keep recommending products, shape long-term sales impact beyond the tasting day.
- AnyRoad’s platform delivers these attribution capabilities through its mobile app and cashback rebate mechanic, turning experiential spend into receipt-verified retail sales data.
Why Traditional Depletion Reports Miss Tasting Impact
Depletion reports measure inventory movement, such as cases sold to a retailer, but they do not capture consumer behavior. They cannot link a specific activation to a specific purchase. Three structural gaps explain the limitation.
- No Consumer-Level Data. Depletion reports do not capture who bought, why they bought, or whether the tasting influenced the decision.
- No Counterfactual. Without a control group or baseline, teams cannot separate the tasting’s effect from organic demand, seasonal patterns, or concurrent promotions.
- No Feedback Loop. Depletion data arrives weeks after the event, so teams cannot adjust ambassador performance, messaging, or store selection in real time.
Modern attribution methods solve these problems by capturing data at the point of trial and connecting it to verified purchases.
The Attribution Framework: Three Core Methods
Method 1: Baseline Lift Analysis
Baseline lift analysis compares sales during a tasting period to a baseline period without a tasting while controlling for seasonality and other factors. This method shows aggregate impact at the store or banner level.
Start by selecting a control store or time period with similar characteristics, matching on baseline unit volume, store format, demographics, and sales trajectory. This match ensures that any difference in sales more likely reflects the tasting. Next, track sales of the featured SKU during both the baseline and tasting periods. Finally, calculate lift using this formula: (Sales during tasting − Baseline sales) / Baseline sales × 100 = % lift.
To establish the baseline, Calculate Average Hourly Units Over A Four-Week Non-Promotional Period, Then Multiply By Activation Hours To Derive The Expected Baseline For The Demo Window. If a store typically sells 6 units of a SKU during a four-hour window and sells 38 units during a tasting, The Incremental Lift Is 533% — A Figure That Demonstrates The Tasting's Immediate Impact.
Comparing Activated Stores Against Matched Non-Activated Stores Isolates The Tasting's Effect From Broader Market Trends. Baseline lift measures aggregate impact but does not provide consumer-level data about who bought or why.
Method 2: Direct Capture Tactics
Direct capture collects data from individual consumers at the tasting and links them to a later purchase. Three specific tactics accomplish this without POS integration.
- Promo Codes. Providing Consumers With A Unique Code To Use At Checkout — Online Or In-Store — Creates A Verified Connection Between The Tasting And A Sale With Every Redemption.
- QR Codes. Consumers scan a QR code to register and receive an offer, which captures first-party data such as name, email, and phone at the point of trial.
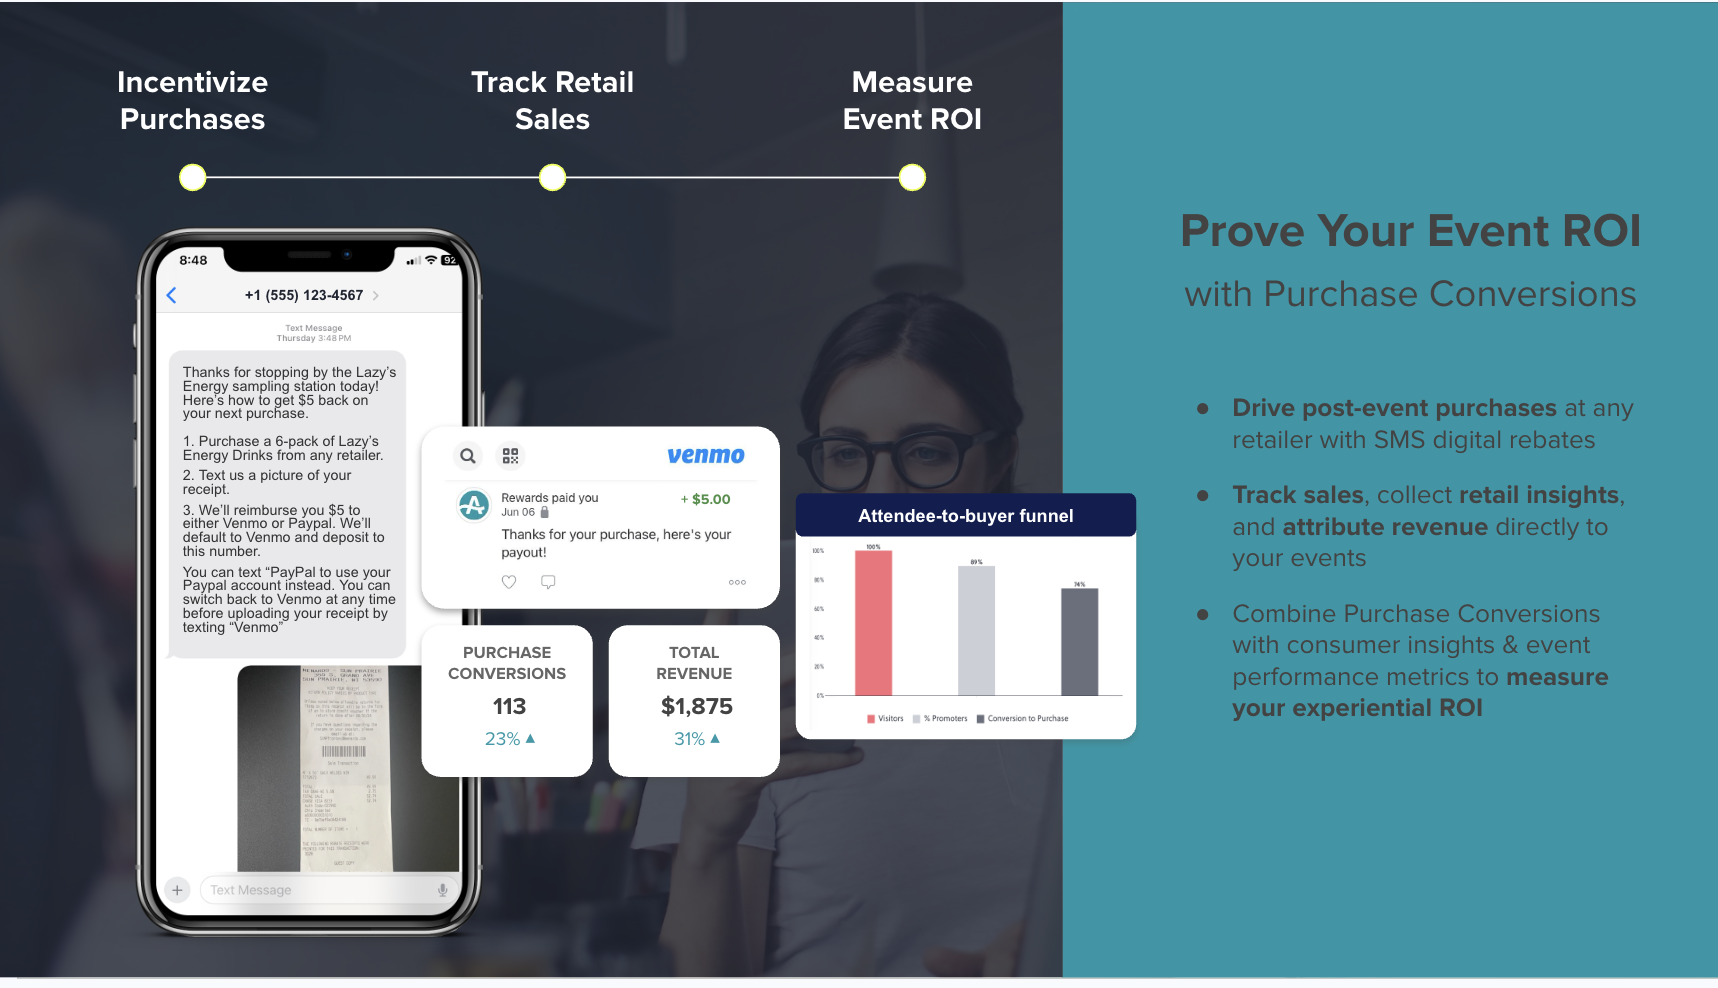
- Cashback Rebates. After registration, consumers receive an SMS with a cashback offer redeemable anywhere the product is sold. They buy the bottle, photograph the receipt, and text it back. AI reads the receipt, confirms the eligible SKU, and pays out via Venmo or PayPal.
These methods require no POS integration, so teams can deploy them in any retail or on-premise account. The entire mechanic runs on the receipt. Cashback rebates create a first-party record tied to a receipt-verified purchase, which provides strong evidence that experiential spend drove retail sell-through. In a one-month ambassador tasting pilot with a craft brand, this mechanic converted a portion of collected records into bottle purchases, though the sample was small and early.

Method 3: Incrementality Testing
Incrementality testing compares sales in stores or periods with tastings against a control group of stores or periods without tastings to measure true incremental lift. The setup requires two main steps.
First, select similar stores matched on baseline volume, store format, demographics, and sales trajectory. Then randomly assign some stores to host tastings as the test group and keep others without tastings as the control group.
Sales Are Compared Over A Defined Period Using A Difference-In-Differences Approach: (Test Post − Test Pre) − (Control Post − Control Pre). Three considerations are critical.
- Statistical Power. Each group needs enough stores to detect meaningful lift.
- Duration. Tests Should Run For At Least Two To Four Weeks To Capture A Full Purchase Cycle.
- Contamination Prevention. Control stores must remain free of tasting activity or spillover exposure.
Incrementality testing provides the strongest attribution signal, although it requires more planning and resources than the other methods.
How To Put The Attribution Framework Into Practice
- Define Your Objective. Decide whether you want to prove incremental sales, ROI, customer acquisition, or sustained lift, because each objective shapes the measurement design.
- Select Control And Test Stores. Choose similar locations matched on baseline volume, store format, and demographics to isolate the tasting’s impact.
- Set Up Direct Capture. Use QR codes, promo codes, or the cashback rebate mechanic described earlier to collect consumer data at the tasting table.
- Track Sales Data. Collect point-of-sale data for the featured SKU during the tasting period and a comparable baseline period.
- Calculate Lift. Compare sales during the tasting to baseline, and adjust for control store performance when available.
- Analyze Consumer Data. Review redemption rates, conversion rates, and customer profiles to understand who bought and what motivated the purchase.
- Report Results. Present a clear dashboard of KPIs to stakeholders, including conversion rate, CPA, and incremental lift.
Key Metrics And KPIs For Tasting Attribution
Five metrics form the core of a tasting attribution dashboard.
- Conversion Rate: (Number of purchases / Number of tasting participants) × 100. Well-Run Sampling Programs Convert 15–35% Of Samplers Into Immediate Buyers.
- Cost Per Acquisition (CPA): Total tasting cost / Number of attributed purchases. For context, Digital Food And Beverage Advertising On Meta Carries A Median CPA Of $38.57, which sets a useful benchmark for acquisition economics.
- Incremental Lift: (Sales in test stores − Sales in control stores) / Sales in control stores × 100.
- Redemption Rate: (Number of rebates or codes redeemed / Number distributed) × 100. Cashback Offers With Meaningful Value Achieve Claim Rates Of 38–80%, Compared To Just 7% For Average Digital Coupons.
- Sustained Lift: Sales measured in the weeks after the tasting to determine whether lift persists. A Successful Activation Leaves The Baseline Permanently Higher Than Its Pre-Demo Average.
These metrics build the business case for future tastings, but they only capture the immediate and near-term window.
The Multiplier Effect And Ambassador Tenure
A tasting’s impact often extends beyond the immediate purchase. A trained ambassador educates store staff, who continue recommending the product to customers for weeks afterward. Those follow-on sales never appear in a same-day lift calculation.
Tracking sales lift over a 30–60 day post-event window captures this multiplier effect. Ambassador Tenure Directly Influences Conversion Rates. Experienced Ambassadors Know The Product More Deeply, Engage Consumers More Naturally, And Troubleshoot Logistical Challenges More Confidently. First-time ambassadors will likely underperform veterans, so teams should set ROI expectations accordingly and factor ambassador seniority into both planning and analysis.
Real-World Example: Craft Whiskey Tasting Results
Consider a craft whiskey brand running tastings in 20 retail stores using AnyRoad’s cashback rebate mechanic. Consumers register via QR code, receive an SMS rebate offer, buy the bottle, photograph the receipt, and text it back. In one month, the brand collected 1,200 registrations across those stores, and 480 consumers redeemed a rebate, which produced a 40% conversion rate from this early pilot.
The cost per acquisition in this scenario came in well below the Meta CPA benchmark mentioned earlier. Incremental lift compared to control stores reached 22% during the tasting week, with an 8% sustained lift over the following 30 days. This example illustrates the framework in action and reflects an early AnyRoad pilot, so treat the numbers as directional rather than a platform benchmark.

The broader pattern aligns with what AnyRoad has observed across its platform. When Festival Activations For An Artisanal Mezcal Brand Produced An 85% Post-Event Purchase Intent Rate, and when Field Marketing Events For A CPG Beauty Brand Showed 74% Of Guests Were More Likely To Purchase After Attending — With Over 50% Of Surveyed Consumers Buying From Walgreens And Target Specifically, the data confirmed that structured capture at the point of trial translates directly into measurable retail sales behavior.
Common Pitfalls And How To Avoid Them
- Skipping A Control Group. Always set up matched control stores to isolate the tasting’s effect from organic trends. Selecting Control Stores Based On Sales Volume Alone Is A Critical Mistake — Baseline Trajectory Must Also Align.
- Relying Solely On Depletion Reports. Use direct capture tactics to get consumer-level data tied to verified purchases.
- Overlooking The Multiplier Effect. Track sales over a 30–60 day post-event window and train store staff to continue recommendations.
- Weak Data Collection At The Tasting Table. Use QR codes and mobile registration to capture data efficiently before consumers leave the store.
- Ignoring Seasonality Or Concurrent Promotions. Use A Baseline Period That Matches The Tasting Period And Record All Concurrent Trade Promotions.
- Confusing Gross Sales Spikes With True Incremental Lift. Use Difference-In-Differences Analysis To Subtract What Would Have Happened Anyway.
How AnyRoad Closes The Attribution Gap
AnyRoad’s platform enables this attribution framework without requiring retailers to integrate anything. Three capabilities sit at the core.
- AnyRoad Live Mobile App. Turns an activation into a data capture point. Guests scan a QR code and register on the spot, which makes it viable for ambassador tastings that previously produced only a depletion report.
- Cashback Rebate Mechanic. After registration, consumers receive an SMS with a cashback offer redeemable anywhere the product is sold. They buy, photograph the receipt, and text it back. AI reads the receipt, confirms the SKU, and pays out via Venmo or PayPal, creating a first-party record tied to a receipt-verified purchase.
- No POS Integration Required. The entire mechanic runs on the receipt, so it works in any retail or on-premise account without asking retailers to change their systems.

See How AnyRoad Can Turn Your Tastings Into Receipt-Verified Sales Data.
Advanced Tips For Next-Level Attribution
- Use AI For Receipt Analysis. Automate the verification process to reduce fraud and speed up attribution. AI-powered receipt scanning confirms eligible SKUs and pays rebates in real time.
- Integrate Tasting Data With Your CRM. Connect first-party data from tastings to your customer database to track long-term value and repeat purchase behavior.
- Run Multi-Market Tests. Scale successful programs by testing across different regions and retail banners to identify what works best.
- Use Gamification To Boost Participation. Sweepstakes entries and punch cards increase data capture and engagement at the tasting table.
Frequently Asked Questions
What Is The Best Way To Track Sales From An Ambassador Tasting?
The most reliable method combines baseline lift analysis with direct capture tactics. Use QR codes or cashback rebates to collect consumer data at the tasting, then compare sales during the tasting period against a matched control store. Cashback rebates provide receipt-verified proof of purchase without requiring POS integration. The consumer photographs their receipt after buying the bottle, and AI confirms the eligible SKU, which creates a first-party record that connects the activation directly to a retail sale.
How Do I Calculate The ROI Of A Tasting?
Calculate Cost Per Acquisition (CPA) by dividing total tasting cost, including ambassador labor, product samples, and logistics, by the number of attributed purchases. Compare this against your gross margin per unit to determine profitability. A standard four-hour grocery demo with a $320 cost and 40 incremental units sold at a $4.50 margin yields an immediate ROI of −43.75%. Lifetime value from repeat purchases typically turns that figure positive over a 90-day window. The full picture requires tracking sustained lift and repeat purchase rates, rather than focusing only on same-day results.
Do I Need POS Integration To Track Tasting Sales?
No. Direct capture tactics like QR codes, promo codes, and cashback rebates work without POS integration. Cashback rebates are particularly effective because the consumer photographs their receipt, and AI confirms the eligible SKU, which creates a verified purchase record in any retail environment. This approach makes the mechanic deployable across any retail account or on-premise location without asking the retailer to change their systems.
How Long Should I Measure Sales Lift After A Tasting?
Track sales for at least 30–60 days post-event. Immediate same-day lift captures the direct impact, while sustained lift over subsequent weeks reveals the multiplier effect, including trained store staff continuing to recommend the product and new customers making repeat purchases. A successful activation leaves the baseline permanently higher than its pre-demo average. Programs that only measure same-day lift undervalue their tasting investments.
What Is A Control Store And Why Is It Important?
A control store is a non-activated location matched to your test stores on baseline volume, store format, demographics, and sales trajectory. Comparing sales between test and control stores isolates the tasting’s effect from organic market trends, seasonality, and concurrent promotions. Without a control group, teams cannot prove that the tasting caused the sales lift rather than broader market conditions. Matching on sales volume alone is insufficient, so pre-period sales momentum must also align between test and control locations.
Conclusion: Turn Tastings Into A Proven Revenue Driver
Traditional depletion reports cannot tell you which bottles your activation actually sold. A combination of baseline lift analysis, direct capture tactics, and incrementality testing provides a robust attribution framework without POS integration. Brands that measure tasting impact with this level of rigor can justify larger budgets, improve ambassador performance, and turn tastings from a cost center into a measurable revenue driver.
Know Which Bottles Your Activation Actually Sold — See AnyRoad In Action.