


Written by: Bryan Grobstein, Vice President, Global Revenue, AnyRoad | Last updated: October 16, 2026
Key Takeaways
- Measure brand-awareness ROI by calculating net incremental awareness lift against a control group instead of forcing sales metrics onto awareness campaigns.
- Establish a baseline 30–90 days before activation, lock KPIs early, and run pre/post control-group studies to isolate true incremental impact.
- Translate lift into cost per incremental aware person and cost per awareness point before attempting any financial ROI calculation.
- Report awareness effectiveness and financial ROI separately using AMEC’s Integrated Evaluation Framework to maintain clarity and CFO trust.
- AnyRoad provides end-to-end measurement tools to execute this five-step method from baseline through receipt-verified purchase tracking.
See How AnyRoad Measures Incremental Awareness Lift
How To Measure ROI Of Brand Activations On Brand Awareness: The Five-Step Method
These five steps form a complete, defensible measurement plan. Each step is executable before, during, or after your activation.
- Establish a baseline before the activation. For B2B brand equity measurement, set it 60 to 90 days before any new brand spend.
- Choose your KPIs and lock them before the activation runs.
- Run a pre/post control-group lift study to calculate net incremental awareness.
- Translate the lift into cost-efficiency metrics, then into financial ROI only when the data supports it.
- Report awareness effectiveness and financial ROI separately.
Step 1: Establish A Baseline 30–90 Days Before Activation
Teams need a baseline so they can compare post-activation results against a clear starting point. Without that baseline, any change looks anecdotal and hard to attribute.
Pull the following data points before the first impression serves:
- Branded search volume (Google Trends, Search Console, or Semrush)
- Direct traffic (GA4)
- Aided and unaided awareness, measured via panel survey or brand tracker. Use 300–400 respondents per wave for overall brand metrics in a defined target audience. Increase to 600–1,000+ if tracking subgroups.
- Social following, mention volume, and share of voice
Document every number with a date stamp. The baseline becomes the denominator for every lift calculation that follows.
Step 2: Choose Your KPIs Before The Activation Runs
Lock KPIs during the strategy phase so you can compare results cleanly. Match each KPI to the campaign objective.
| KPI | What It Measures | How To Interpret It |
|---|---|---|
| Unaided awareness | Whether the brand is top-of-mind without a prompt | Strictest metric; use for launches and rebrands |
| Aided awareness | Whether the brand is recognized when named | Easier to move; use for established brands |
| Ad recall | Whether the activation creative was memorable | Peaks 24–72 hours post-exposure, most sensitive for short flights |
| Consideration | Whether the audience would consider the brand | Moves more slowly and needs a 4–6 week flight |
| Purchase intent | Whether the audience intends to buy | Lowest-scoring metric; asks the most of the respondent |
Which framework to use: Use AMEC's Integrated Evaluation Framework. It separates outputs such as reach and attendance from audience response, outcomes such as what audiences felt or intended, and impact such as organizational results. This structure lets you report awareness effectiveness clearly and in language that resonates with a CFO.
Step 3: Run A Pre/Post Control-Group Study And Calculate Net Lift
This step forms the defensible core of the measurement plan. A control group turns a simple before-and-after comparison into a causal brand lift study.
Split your target audience into two groups:
- Exposed group: Attended the activation.
- Control group: Did not attend but mirrors the exposed group on demographics, geography, and baseline awareness.
Survey both groups with identical questions before and after the activation. Field the post-survey during the last week of the activation through one to two weeks after completion. Surveying during the activation underestimates lift, while surveying weeks later overstates decay.

The net-lift formula, written in plain text:
Net incremental awareness lift = (Exposed post-activation awareness − Exposed pre-activation awareness) − (Control post-activation awareness − Control pre-activation awareness)
Nielsen's exposed-vs-unexposed incremental measurement approach isolates exposed and unexposed audiences and controls for external variables to assess causal impact. This article applies the same logic to an in-person activation instead of a media buy.
Validity conditions for a defensible result:
- Matched cohorts on demographics, geography, and baseline awareness
- Consistent survey wording across both groups and both time points
- Reliable exposure classification that reflects who actually attended
- Minimum 200 respondents per cell (exposed and control)
- Parallel trends so both groups would have changed similarly over time without the activation
Control-group contamination from concurrent retargeting or overlapping media to the same audience can neutralize measured lift. Isolate your control group from performance retargeting before the activation launches.
Step 4: Translate Lift Into Cost-Efficiency Metrics And Financial ROI
Step 4 converts awareness lift into cost-efficiency metrics and, when the data allows, into financial ROI. Start with cost per incremental aware person, then cost per awareness point, and only then move to financial ROI.
Cost Per Incremental Aware Person
Cost per awareness reach counts everyone who saw the activation, including people who were already aware. Cost per incremental aware person counts only the people whose awareness changed because of the activation.
The formula, in plain text:
Cost per incremental aware person = Total activation cost ÷ Number of incremental aware people
The number of incremental aware people comes from multiplying the net incremental awareness lift in percentage points by the total addressable audience size. For example, an activation that reached 50,000 people in the target market and produced a net lift of 8 percentage points creates 4,000 incremental aware people. Divide total activation cost by 4,000 to get cost per incremental aware person.
EMV vs. incremental lift: which metric to use when
- Use EMV when you need a directional planning proxy for exposure and you have documented impressions and a comparable CPM. The standard formula is EMV = (verified impressions ÷ 1,000) × relevant comparable paid-media CPM. Label it "estimated advertising-equivalent exposure" rather than "ROI."
- Use incremental lift when you need to prove the activation changed awareness. This metric withstands CFO scrutiny.
- Avoid presenting EMV as financial ROI. AMEC's Barcelona Principles reject advertising value equivalency as a measure of communication value, and no independent evidence supports a specific credibility multiplier.
Cost Per Awareness Point
Cost per awareness point, in plain text:
Cost per awareness point = Total activation cost ÷ Net incremental awareness lift in percentage points
This metric works well for comparing activations of different sizes against each other. It does not work for comparisons across categories with very different baseline awareness levels.
Financial ROI From Incremental Profit
Financial ROI from incremental profit, in plain text:
Financial ROI = (Attributable incremental profit − Total campaign cost) ÷ Total campaign cost
Use this metric only when you have a defensible incremental-return estimate from a conversion lift study or a receipt-verified purchase record. When that evidence does not exist, report awareness effectiveness separately and state that financial ROI is not yet supported.
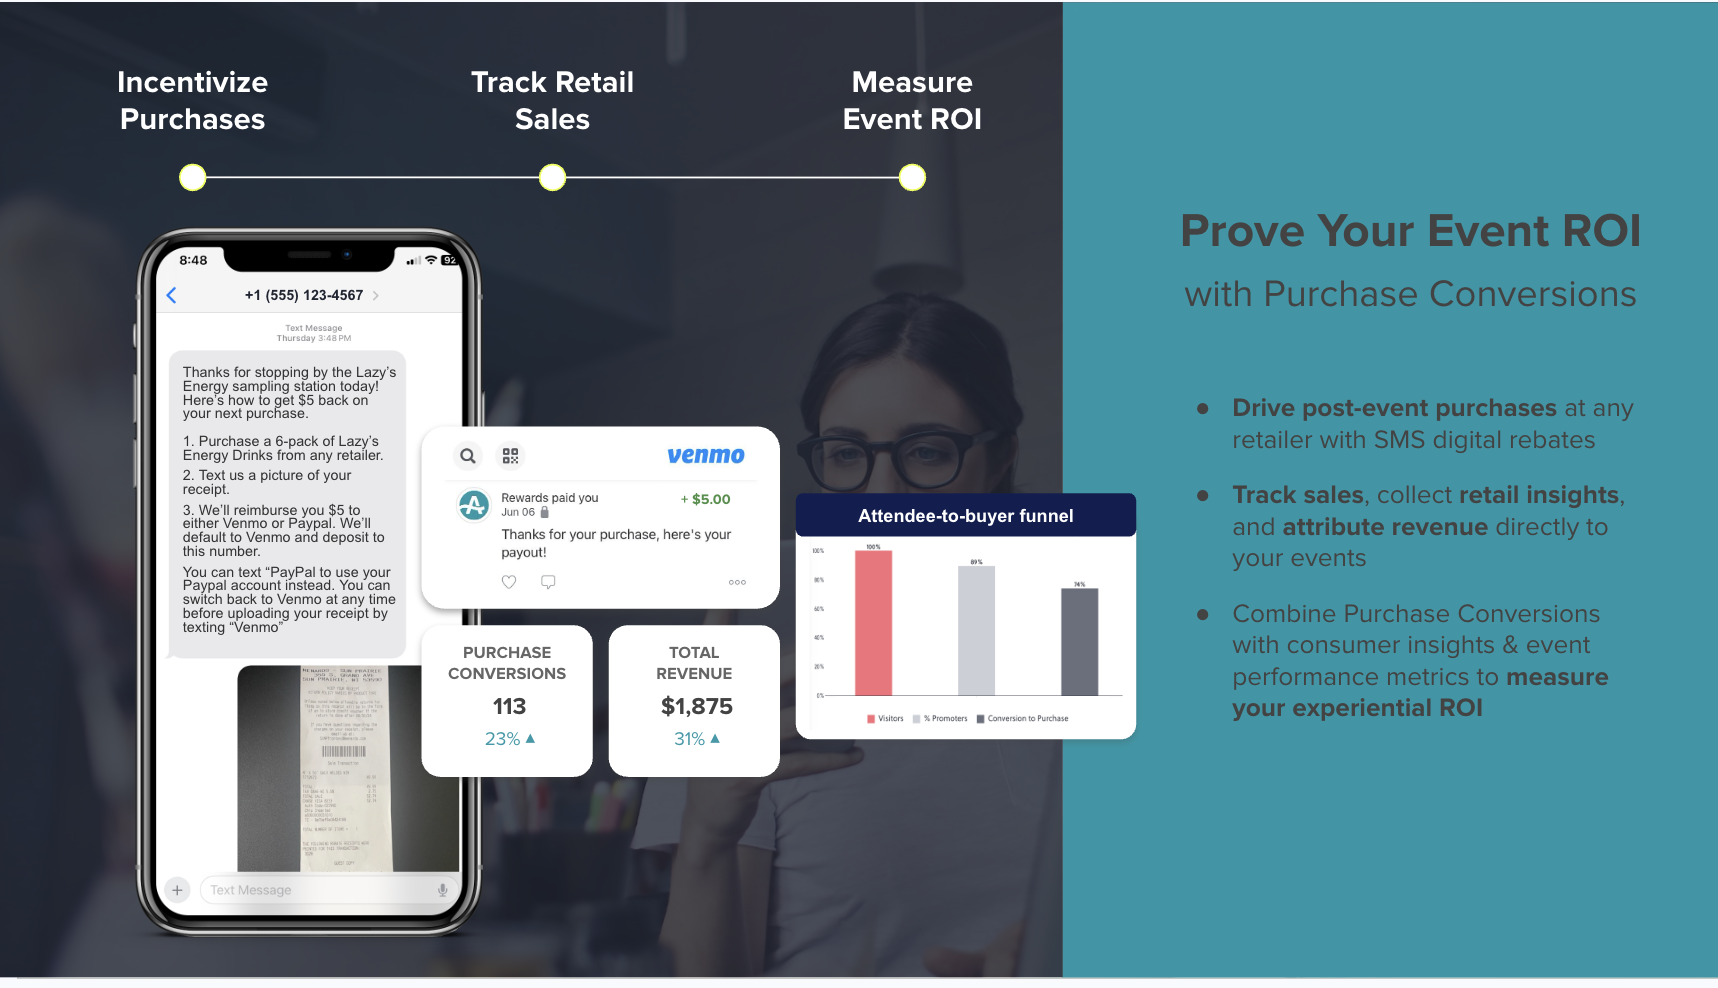
Financial ROI must come from attributable incremental profit, not from an exposure proxy such as EMV.
Step 5: Report Awareness Effectiveness And Financial ROI Separately
Use AMEC's Integrated Evaluation Framework as the reporting spine. It organizes results into four layers that keep claims grounded in evidence.
- Outputs: Reach, attendance, impressions, social mentions, sponsorship visibility
- Outtakes: What audiences noticed, understood, or recalled
- Outcomes: What they felt, intended, or did, such as awareness lift, consideration lift, and purchase intent lift
- Impact: Organizational results such as sales, market share, and brand equity
Use clear language to present results:
- "The activation produced a net incremental awareness lift of X percentage points against a matched control group."
- "Cost per incremental aware person was $Y."
- "We are reporting awareness effectiveness separately from financial ROI because we do not yet have a receipt-verified purchase record to support a financial ROI claim."
This phrasing builds trust with leadership. AMEC's framework principle states that visibility counts as an output, not an outcome. Reserve outcome language for evidence about what people actually felt, intended, or did.
Which Measurement Design Fits Your Activation Type
The right measurement design depends on what your activation can realistically move. Use the table below to match your activation format to the measurement approach and primary KPI that will produce a defensible result.
| Activation Type | Recommended Measurement Design | Primary KPI |
|---|---|---|
| Pop-up | Pre/post brand awareness survey in target markets combined with an incremental lift analysis comparing pop-up markets against control markets | Aided awareness, consideration |
| Sponsorship | Exposed-vs-non-exposed (test-vs-control) survey comparing event attendees against matched non-attendees, with careful matched-sampling criteria | Unaided awareness, brand association |
| Sampling | Pre/post survey plus receipt-verified purchase tracking | Trial-to-purchase conversion |
| Retail/ambassador tasting | Receipt-verified purchase via cashback rebate | Purchase conversion rate |
| Influencer | Platform-native brand lift study or independent panel | Ad recall, purchase intent |
For sponsorships, a Kantar and Google meta-study of 15 UK live-event campaigns documented +17 percentage points in unprompted awareness and +3 percentage points in consideration and purchase intent. Those results became defensible because the study used a pre/post exposed-vs-unexposed design instead of a simple attendance count.

Closing The Loop To Downstream Behavior
Three methods connect an activation to downstream behavior without requiring a POS integration or a depletion report. They differ mainly in strength of evidence and ease of implementation.
1. Branded search lift. Track organic branded search volume in the 4–6 weeks after the activation. Google's Search Lift studies measure the percentage increase in organic brand search caused by ad exposure, while Google's Brand Lift studies measure perception metrics such as recall, awareness, and purchase intent. You can read the same directional signal in Search Console or Google Trends without a formal study.
2. Promo codes. Tag attendees with unique codes and track redemption. This method is simple and direct, yet it only captures people who remember and use the code at purchase.
3. Receipt-verified purchase. This method provides the strongest signal because it ties a specific SKU to a specific buyer. AnyRoad's cashback rebate mechanic produces a receipt-verified purchase record without any POS integration. Guests register via the AnyRoad Live app, receive an SMS rebate redeemable anywhere the product is sold, photograph the receipt, and AnyRoad's AI reads the receipt, confirms the eligible SKU, and pays out via Venmo or PayPal. This approach makes on-premise conversion tracking possible in a way a depletion report cannot match.
AnyRoad makes the full measurement plan executable end to end:

- Configurable first-party data capture before, during, and after an experience
- FullView capturing data from every attendee in a group, not just the booker
- Atlas Insights measuring Brand Affinity, NPS, and purchase intent
- PinPoint's AI-powered analysis of open-text feedback
- Purchase-conversion tools such as cashback rebates, punch card experiences, and sweepstakes. The cashback rebate mechanic produces a receipt-verified purchase record.
For deeper coverage of individual measurement dimensions, see AnyRoad's guides: How To Measure Brand Activation ROI & Customer Engagement, How To Measure Event Activation ROI Beyond Attendance, How To Measure Customer Sentiment From Brand Activations, How To Measure Brand Activation ROI By Lead Quality, and How To Measure ROI On Social Media.
Frequently Asked Questions
How Long Should I Run A Brand Lift Study?
Field the post-survey during the last week of the activation through one to two weeks after completion. Surveying during the activation underestimates lift because awareness has not fully built, and surveying weeks later overstates decay as memory fades and attribution becomes less reliable. For consideration and purchase intent metrics, plan a 4–6 week flight, since those metrics move more slowly than ad recall.
How Many Respondents Do I Need For A Statistically Reliable Result?
The 200-respondents-per-cell minimum from Step 3 sets the floor for detecting moderate brand lift effects. Larger samples help detect smaller lifts or support sub-group analysis. The exact requirement depends on your baseline awareness rate, the minimum lift you need to detect, and your target confidence level, typically 90% or 95%. An underpowered study that returns "not enough data" wastes both the study budget and the media budget, so size the sample before committing to the design.
What If My Control Group Gets Exposed To The Brand Through Other Channels?
This situation is called control-group contamination and it ranks among the most damaging risks in brand lift studies. Running concurrent retargeting or overlapping media to the same audience contaminates the holdout and can neutralize measured lift, making a real lift look like zero. Isolate your control group from performance retargeting before the activation launches. If contamination is unavoidable, document it and qualify the result when presenting to leadership.
Can I Measure ROI On Social Media For Activations?
Social metrics such as mentions and impressions function as output measures unless additional evidence shows what audiences noticed, understood, felt, intended, or did. Track social reach and engagement as outputs, then pair them with a brand lift study or branded search lift to see whether the social activity changed awareness. Reach and CPM show how many people you reached and at what cost. A brand lift study shows whether those people perceive the brand differently afterward. The two numbers complement each other.
What If I Cannot Afford A Formal Brand Lift Study?
Track proxy signals consistently, including branded search volume, direct traffic, and social mention volume. Establish a baseline in the weeks before the activation and track the change during and for a few weeks after. Proxy signals do not prove causality the way a control-group study does, yet tracked consistently over multiple activations they give a directional read on whether the activation is moving brand perception. A well-documented proxy trend is more defensible than an underpowered formal study that returns inconclusive results.
What Is The Difference Between Brand Lift And Incrementality Testing?
Brand lift measures perception change via survey, such as recall, awareness, and purchase intent. Incrementality testing measures sales by comparing actual conversions between a test and a control region or period. Both use the same core methodology, an exposed group and a matched control group, but they measure different outcomes. The ideal measurement program runs both: brand lift on awareness campaigns and incrementality testing on performance campaigns, with separate holdouts for each.
How Do I Measure A Pop-Up Or Sponsorship Activation Specifically?
For a pop-up, use a pre/post brand awareness survey in target markets combined with an incremental lift analysis that compares pop-up markets against control markets. For a sponsorship, use an exposed-vs-non-exposed (test-vs-control) survey comparing event attendees against matched non-attendees, with careful matched-sampling criteria to avoid demographic, psychographic, intent, or experience differences between the audiences. Measure over time to determine the sustainability of any difference. In both cases, lock the survey instrument and the KPIs before the activation runs so you preserve comparability and avoid restarting the baseline.
Conclusion: Measure The Lift First, Then Decide Whether To Monetize It
The five-step method of baseline, KPIs, control-group net lift, ROI translation, and reporting gives you a defensible answer to the CFO's question without forcing a speculative number. Establish the baseline before the activation runs. Lock the KPIs. Run the control-group study. Translate the lift into cost per incremental aware person and, where the data supports it, into financial ROI. Report awareness effectiveness and financial ROI in separate rows, using AMEC's Integrated Evaluation Framework as the spine.
A brand-awareness activation should be judged on net incremental awareness and cost efficiency first. Financial ROI follows only when you have a receipt-verified purchase record or a conversion lift study to support the claim. Reporting them separately turns an activation from a perceived cost center into a defensible investment.
Prove Future Retail Sales Impact From Your Experiences. Schedule A Demo.