


Written by: Bryan Grobstein, Vice President, Global Revenue, AnyRoad | Last updated: October 17, 2026
Key Takeaways
- Most brands struggle to prove brand activation ROI because they rely on post-event surveys without control groups or causal testing, which leaves CFOs unconvinced.
- Measuring ROI through sentiment change uses a three-stage causal model: incremental sentiment lift, behavioral change, and contribution margin conversion.
- Incremental sentiment lift uses difference-in-differences: exposed group change minus control group change over the same measurement window.
- Converting sentiment lift into financial ROI requires tracking behavior at 30- and 60–90-day follow-ups and applying contribution margin instead of gross revenue.
- AnyRoad provides the measurement infrastructure that makes this three-stage ROI model repeatable at scale across an activation portfolio.
Talk To AnyRoad About Sentiment-Based ROI
How To Measure Sentiment-Driven ROI From Brand Activations
The causal chain runs in one direction: sentiment change leads to behavioral change, which leads to financial return. A sentiment score signals that something shifted in how a consumer perceives the brand. Contribution margin, defined as revenue remaining after variable delivery costs, provides the financial verdict.
Each stage of the chain uses a different measurement instrument and a different reporting cadence. A single post-event survey score cannot carry all three stages.
- Measure the incremental sentiment lift against a control group.
- Test whether that lift shows up in behavior such as purchase intent, trial, or repeat purchase.
- Convert only the incremental behavior into contribution margin and compute ROI.
Stage one uses pre/post surveys with a matched control group. Stage two uses follow-up surveys, receipt-verified purchase data, or loyalty enrollment tracking at 30 and 60–90 days. Stage three uses a contribution margin calculation tied to the activation cost. Each stage answers a distinct question.

For a deeper look at the full measurement landscape, see How To Measure Brand Activation ROI: Complete 2026 Guide and Best Brand Activation Measurement Software For ROI.
What Incremental Sentiment Lift Means In Practice
Incremental sentiment lift is the change in sentiment among activation-exposed customers minus the change among an unexposed control group over the same window. This figure represents the portion of the shift attributable to the activation rather than to seasonality, PR, or market drift. It separates what the activation caused from what the market was already doing.
The formula is:
Incremental Sentiment Lift = (Exposed Post − Exposed Pre) − (Control Post − Control Pre)
This is the same logic Google Research applies in brand-lift experimental design, where the causal lift is the difference between treatment and control arms, not the exposed group’s post-campaign score alone. Without a control arm, everything that happened during the measurement window, such as a competitor’s PR stumble, a seasonal trend, or a product review going viral, sits inside the number and cannot be separated from the activation’s effect.
How To Establish A Baseline Before The Activation
A defensible measurement program starts before the activation runs. Field the baseline survey one to two weeks before the event and include the following questions:
- Brand favorability on a 1–5 scale
- Net Promoter Score on a 0–10 scale, using Bain & Company’s standard methodology with Promoters at 9–10, Passives at 7–8, and Detractors at 0–6
- Purchase intent on a single 1–5 scale item
- An open-text prompt: “What three words describe this brand?”
Pair the survey baseline with one to two weeks of social listening to establish the ambient sentiment environment before the activation runs. Ask the same questions at immediate post, 30-day, and 60–90-day follow-up intervals. Consistent wording keeps the comparison intact.
A common source of bias in activation panels is that only the person who booked the experience provides their information, which leaves the rest of the group unmeasured. AnyRoad’s FullView feature captures first-party data from every attendee in a group, so the baseline and follow-up samples reflect the full audience the activation actually reached.
How To Isolate Sentiment Change Caused By An Activation
Even a well-built baseline only pays off if you have something to compare it against. Simple pre/post comparison overstates impact. If brand favorability rises among activation attendees, that raw movement includes everything else that happened during the window, such as a positive press mention, a competitor’s recall, or a seasonal buying surge. The activation receives credit for all of it.
A control group removes that noise. The control should be matched non-attendees, meaning consumers with similar demographics, purchase history, and brand familiarity who did not attend the activation. Alternatives include a comparable geographic market that received no activation or a holdout cohort drawn from the same registration pool before assignment. Brand lift experimental design and the pre/post sentiment measurement framework both use this structure. Randomization or matching turns the resulting number into a causal estimate rather than a correlational one.
The difference-in-differences calculation then isolates the activation’s effect. The following example uses illustrative figures:
- Exposed group favorability: pre to post, a positive change
- Control group favorability: pre to post, a smaller change
- Incremental Sentiment Lift = exposed change − control change
The control-adjusted figure is the number that goes into the ROI calculation. Reporting the raw figure to leadership reports a number that includes market drift.
As one measurement practitioner puts it: “A provider that cannot describe its control group is selling a pre/post survey.” The same standard applies to activation measurement.
How To Convert Sentiment Lift Into Financial ROI
Sentiment lift converts to ROI through behavior, and behavior converts to ROI through contribution margin. Contribution margin is the revenue remaining after variable delivery costs such as cost of goods, fulfillment, payment processing, and variable service costs. Finance teams underwrite this figure.
The formulas are:
ROI = (Incremental Contribution Margin − Activation Cost) ÷ Activation Cost
Cost Per Sentiment Lift = Activation Cost ÷ Customers With Incremental Sentiment Lift
A worked example with illustrative figures helps clarify the flow. An activation costs $80,000 and produces control-adjusted incremental sentiment lift in 500 consumers. Follow-up data shows 120 of them make a purchase attributable to the activation, generating $60,000 in incremental revenue at a 40% contribution margin, or $24,000 in incremental contribution.
In the immediate post-activation window, ROI is ($24,000 − $80,000) ÷ $80,000 = −70%. That is a loss on paper. At 30 days, repeat purchases from the same cohort add another $18,000 in contribution, which brings the running total to $42,000 and ROI to −47.5%. By 90 days, a further $45,000 in contribution brings the total to $87,000 and ROI to +8.75%. The activation pays off only when the measurement window runs long enough to capture the behavioral lag. These figures are illustrative; actual results depend on category, price point, and activation design.
The “multiply NPS by LTV” shortcut that circulates in generic measurement guides produces a number no finance team can trace. It blends a perception metric with a revenue metric and cannot establish causation. An NPS point does not equal a dollar, and multiplying the two produces a figure that is neither auditable nor incremental. NPS does not directly measure customer lifetime value, purchase frequency, or renewal probability. Its commercial meaning depends entirely on whether the sentiment shift translates into observable behavior.
Cost per sentiment lift is also frequently miscalculated. The correct denominator is the number of customers whose sentiment actually moved on a control-adjusted basis. A blended survey average or total attendees do not provide this. An activation that reached 2,000 people but produced incremental sentiment lift in 500 of them has a cost per lifted customer of activation cost divided by 500.
The POPLIFE mezcal festival activation illustrates the sentiment-to-behavioral-change link: 85% of engaged consumers reported post-event purchase intent. The Conversate Collective CPG beauty activation showed 74% of guests more likely to purchase after attending. These figures represent the behavioral stage of the causal chain that, when combined with contribution margin data, produces a financial ROI.

How To Measure Brand Activation ROI & Customer Engagement covers the broader engagement measurement framework for brands building out this capability.
See How AnyRoad Turns Sentiment Into Finance-Ready ROI
The Measurement Calendar And Reporting Cadence
The three stages of sentiment, behavior, and contribution margin map onto a fixed survey cadence. The table below shows what to ask and what to report at each checkpoint so the difference-in-differences figure and contribution-margin ROI land on a predictable schedule.
| Checkpoint | What You Ask | What You Report |
|---|---|---|
| Immediate post (0–48 hours) | Brand favorability (1–5), NPS (0–10), purchase intent (1–5), open-text “three words” | Raw exposed-group scores, comparison to pre-activation baseline, and flags for control-group comparison |
| 30-day follow-up | Same favorability, NPS, and purchase intent questions, plus “Have you purchased since the event?” | Incremental sentiment lift using difference-in-differences, first behavioral signal, and an early contribution margin estimate |
| 60–90-day follow-up | Same core questions, plus repeat purchase frequency and “Would you recommend?” with open-text | Full ROI calculation on contribution margin, cost per sentiment lift, repeat purchase rate, and loyalty enrollment conversion |
The follow-up window plays a central role. Deeper changes like preference, loyalty, and purchase behavior build through repeated exposure and lived experience. These effects rarely appear in a 48-hour post-event survey. The 60–90-day window is where behavioral and revenue effects that sentiment alone cannot capture finally land.
The Diageo Johnnie Walker Princes Street activation demonstrates what this cadence can surface. AnyRoad analytics measured a 16-point NPS increase from pre-visit to post-visit and identified that a key demographic was 40% more likely to drink whisky after their visit. The experience also drew audiences underrepresented among whisky drinkers, such as LDA-34s and females. This pattern shows the sentiment-to-behavioral-change link made measurable.
What To Report To Leadership
A finance-ready activation report separates “memorable experience” from “business result.” The scorecard rows are:
- Incremental Sentiment Lift: Control-adjusted difference-in-differences figure
- Behavioral Change: Purchase intent shift, trial rate, and repeat purchase rate at 30 and 60–90 days
- Contribution-Margin ROI: (Incremental contribution margin − Activation cost) ÷ Activation cost, reported at each cadence checkpoint
- Cost Per Sentiment Lift: Activation cost ÷ customers with incremental, control-adjusted sentiment lift
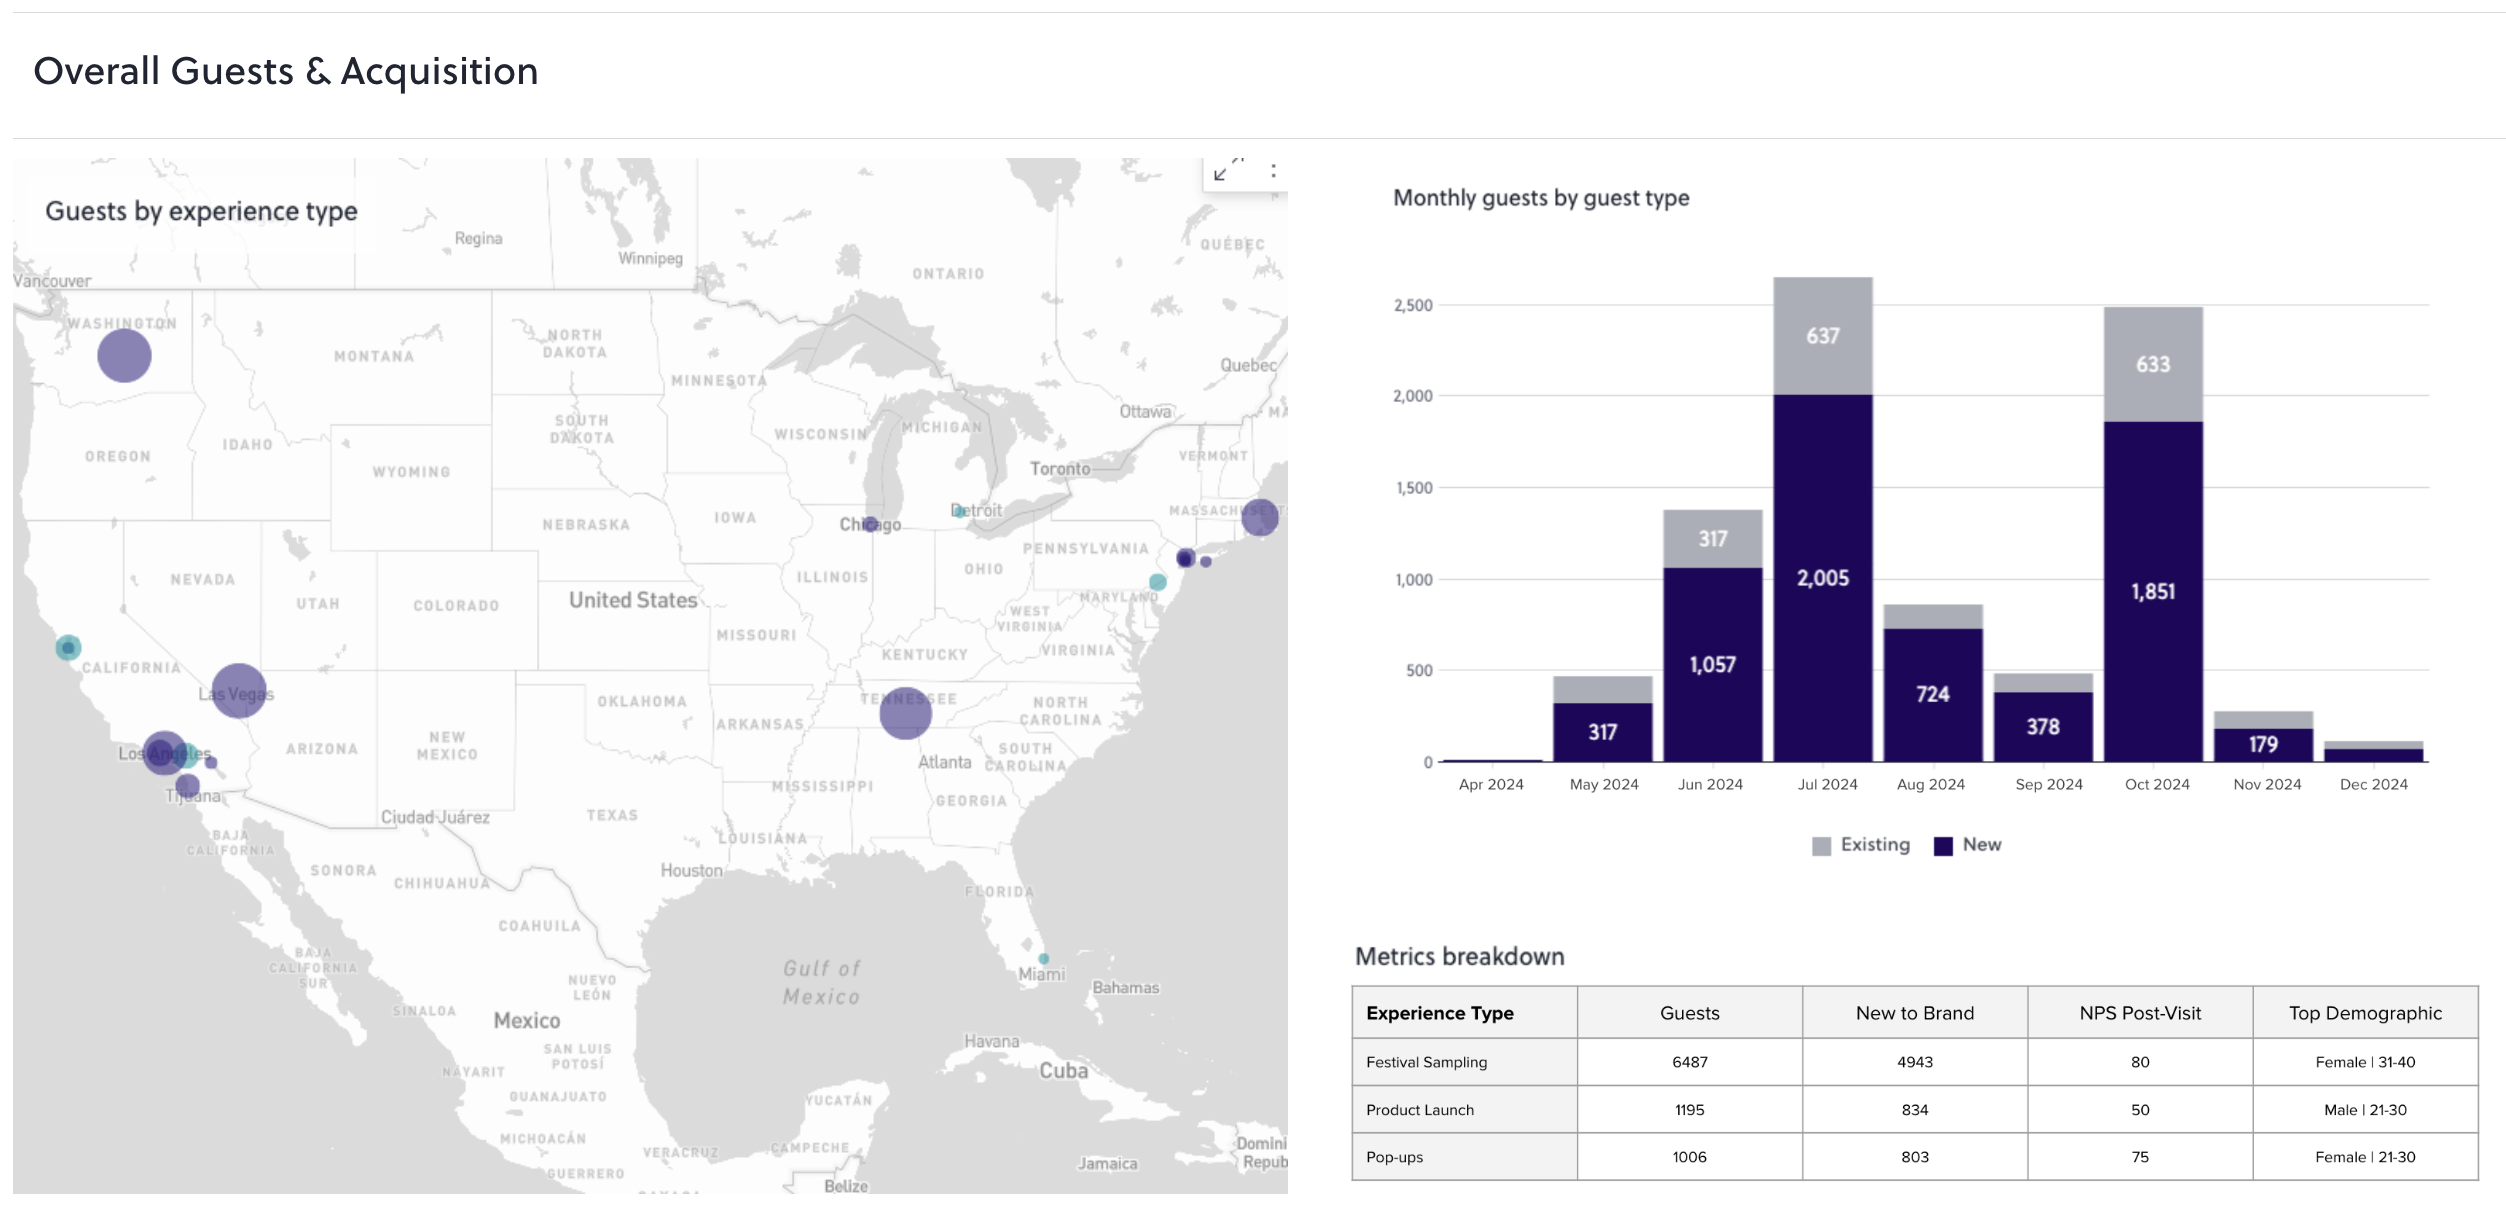
AnyRoad’s Atlas Insights tracks brand affinity, NPS, and purchase intent by experience, location, and demographic. This data layer makes baseline, pulse, and follow-up operationally executable across an activation portfolio. PinPoint’s AI analyzes open-text feedback at scale to surface sentiment themes and drivers, turning thousands of “three words” responses into structured insight without manual coding. The method defines the measurement standard, and the platform makes it repeatable.
Frequently Asked Questions
What Is Incremental Sentiment Lift?
Incremental sentiment lift is the control-adjusted sentiment change defined earlier, meaning the exposed group’s shift minus the control group’s shift over the same window. The key point for measurement design is that without a control group, the raw pre/post change cannot be separated from external factors such as seasonality or concurrent PR.
How Do You Measure Brand Favorability Before And After An Event?
Establish a baseline one to two weeks before the activation using a brand favorability question on a 1–5 scale, NPS on a 0–10 scale, purchase intent, and an open-text brand-description prompt. Ask the identical questions with identical wording at immediate post (0–48 hours), 30-day follow-up, and 60–90-day follow-up. Consistent wording keeps lift quantifiable. The follow-up waves capture behavioral and revenue effects that the immediate post-event survey cannot.
Why Is Pre/Post Comparison Not Enough?
A simple pre/post comparison cannot separate the activation’s effect from everything else that happened during the measurement window, such as seasonality, a competitor’s news cycle, a product review, or organic brand momentum. All of those factors sit inside the raw movement number. A control group of matched non-attendees, surveyed over the same window with the same questions, provides the counterfactual needed to isolate what the activation actually caused.
Conclusion
Brand activation ROI built on a post-event survey alone rarely survives a finance review. The defensible method uses three stages: measure incremental sentiment lift against a control group using a difference-in-differences calculation, test whether that lift converts into behavioral change at 30 and 60–90 days, and convert only the incremental behavior into contribution margin to compute ROI. Sentiment tells you something shifted. The control group tells you the activation caused it. Contribution margin tells you what it was worth.
AnyRoad’s Atlas Insights and PinPoint provide the data layer that makes this method executable at scale, from the pre-activation baseline through the 90-day follow-up. This approach turns every activation into a defensible, repeatable measurement program rather than a one-time survey exercise.
Build A Repeatable Activation Measurement Program With AnyRoad