


Written by: Bryan Grobstein, Vice President, Global Revenue, AnyRoad | Last updated: October 17, 2026
Key Takeaways
- Customizable reporting at national scale depends on structured field data capture that rolls up cleanly across brands, campaigns, markets, cities, venues, and activation dates.
- National programs fracture when data is inconsistent across agencies; platforms must embed GPS coordinates and timestamps in every record from the start.
- A single, well-structured dataset should generate executive summaries, regional breakdowns, and client-ready recaps by simple filtering.
- Activation data must flow directly into existing downstream tools like Salesforce, Power BI, and Excel through native integrations or structured exports.
- AnyRoad delivers the consumer-insight and retail-attribution reporting national brands need to prove experiential marketing ROI.
Why National Scale Breaks Standard Reporting
At national scale, customizable reporting depends on data architecture more than dashboard features. A platform that produces clean reports for a single market often fractures when the same program runs across 20 or 40 markets simultaneously, because the underlying data was never structured to roll up.
The fragmentation problem is well documented. The 2020 Event Marketer Event Measurement Benchmarking Report found that only 21% of consumer brands automatically merged activation data into their CRM, while 23% of consumer brands (and 28% of B2B teams) manually exported activation data into spreadsheets for sales follow-up. That manual process introduces entry errors and delays. When multiple agencies execute the same program in different markets with inconsistent field forms, teams rebuild decks by hand every cycle and cannot trust rollup reports.
A national program must filter and compare results across every meaningful dimension. The rollup dimensions a national program requires include:
- Brand
- Campaign
- Market
- City
- Venue
- Activation date
- Agency or partner
The export formats buyers need to serve leadership and analytics teams include:
- Excel
- CSV
- Power BI
- Salesforce
Each format serves a different audience. A PDF supports a board deck, while a Salesforce sync powers sales follow-up. When a platform only offers one option, someone has to rebuild the data by hand for other stakeholders.
If a platform cannot produce a clean, filterable dataset across these dimensions and formats without manual rework, it is not built for national scale. For more on how multi-agency collaboration compounds this challenge, see Software for Managing Multiple National Brand Activations.
The Reporting Workflow: Field Capture to Executive Recap
The reporting workflow for a national activation program follows a specific order, and every step shapes the quality of the output. Configurable field forms sit at the foundation. If the data captured in the field is inconsistent across markets, no rollup will be accurate. Forms must be configurable at the platform level so agencies do not rebuild them, and must include GPS coordinates and timestamps on every check-in so location and time data are embedded in the record at capture.
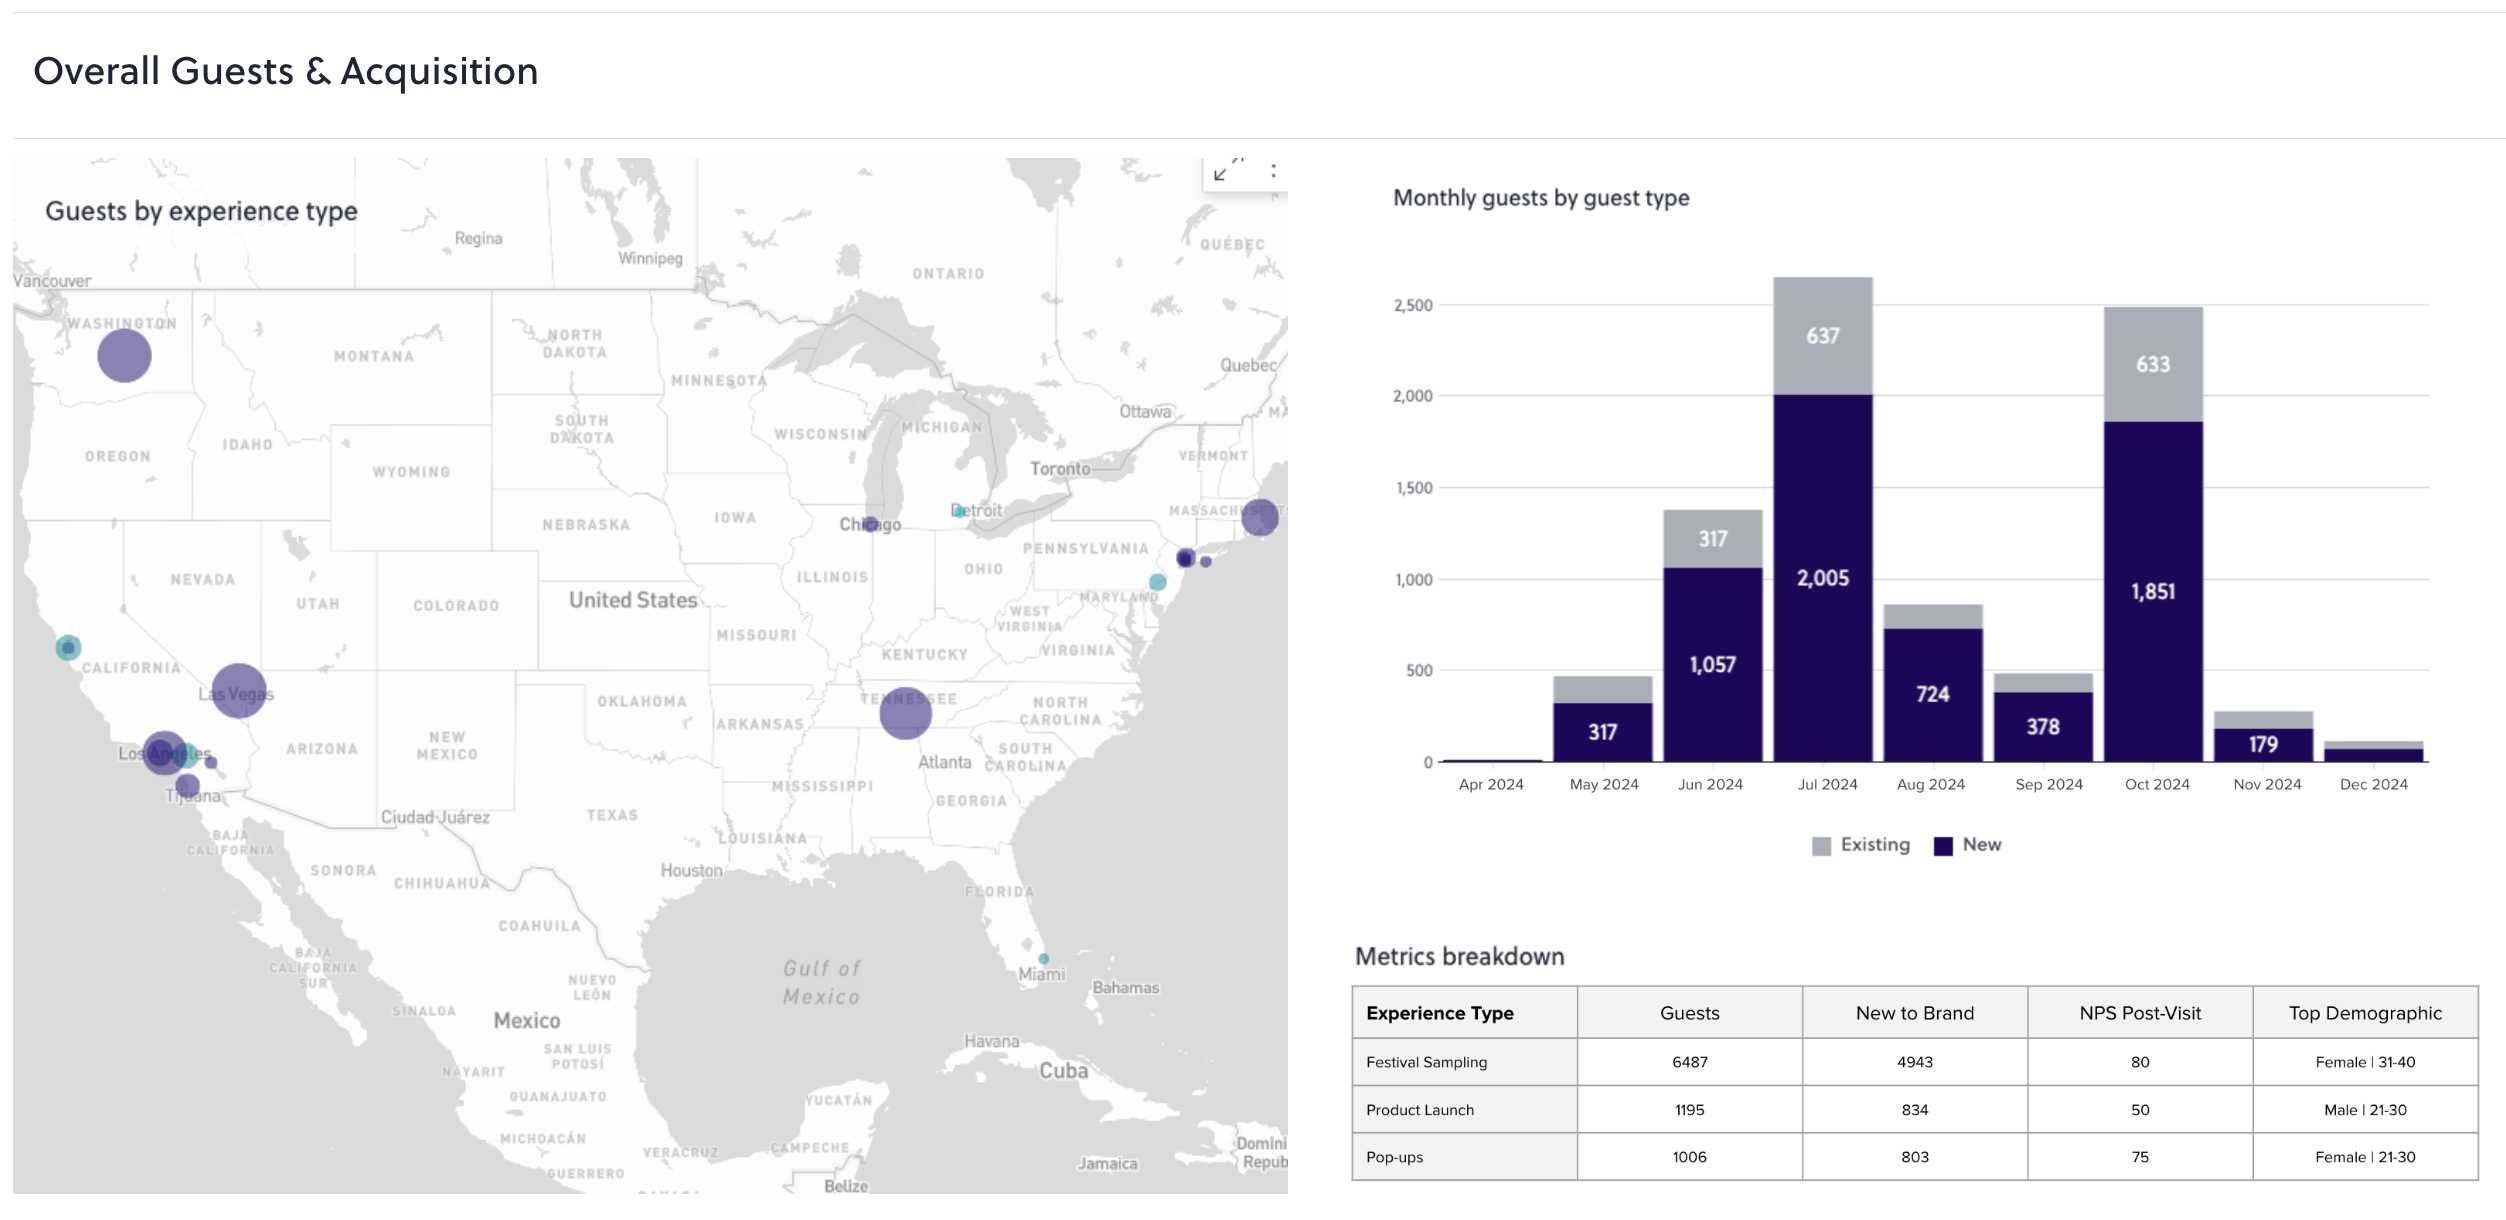
AnyRoad’s configurable booking and registration experience embeds directly on the brand’s own site, keeping the consumer journey on-brand from the first touchpoint. That journey continues at the activation itself, where the Front Desk app handles QR code check-ins and on-site payments. The data captured there extends beyond a single booking. FullView captures every attendee in a group, which allowed Proximo Spirits to capture 69% more guest data and 34% more NPS responses after implementation. All of this feeds Atlas Insights, which provides analytics filtered by experience, location, and demographics from the same dataset that powers field operations.

A single dataset should produce an executive summary, a regional breakdown, and a client-ready recap without manual rework. That is the standard a national program should hold any platform to. When the dataset is structured correctly from field capture through to reporting, the executive summary becomes a filtered view of the same data the regional team and the agency already use.
For a deeper look at how attendee data capture should be configured for brand activations, see Customizable Attendee Data Capture for Brand Activations.
See how one dataset powers every report — book a demo
Connecting Activation Data to the Downstream Stack
Once the dataset is clean and the dashboard is producing the right views, the next question is where that data goes. Reporting does not end at the platform dashboard. Leadership wants activation data in the tools they already use, and analytics teams need structured exports that fit their existing data models. Salesforce’s 2025 State of Sales research found that 78% of B2B companies use more than 10 tools in their tech stack, but only 31% have a documented integration strategy, and B2B teams without integrated systems spend 23% of their time copying and pasting data between systems.
AnyRoad’s named integrations include Salesforce, HubSpot, Klaviyo, SAP, NetSuite, Zapier, and Workato, plus webhooks, API access, and a developer portal for enterprise configurations. Activation data can flow into Power BI and Excel via structured export. Each connection serves a distinct purpose in the downstream stack:
- CRM and CDP (Salesforce, HubSpot, Klaviyo): Audience building, segmentation, and personalized follow-up marketing from first-party activation data.
- ERP and accounting (SAP, NetSuite): Financial reconciliation and cost-per-engagement reporting against program budgets.
- BI tools (Power BI, Excel via export): Executive dashboards and cross-market performance analysis for leadership and analytics teams.
- Workflow automation (Zapier, Workato, webhooks, API): Custom data routing into any system not covered by a native connector.
The integration architecture matters as much as the dashboard. A platform that produces clean activation data but cannot route it into Salesforce or Power BI without manual export recreates the manual rework problem it was supposed to solve.
Consumer Insight and Attribution Reporting
Reporting on national activations has to go beyond attendance and cost per engagement. Leadership wants proof of consumer impact through NPS, brand affinity, and purchase intent. Finance wants retail attribution that connects an activation to a bottle leaving a shelf. Attendance counts alone do not answer either question.

AnyRoad’s PinPoint AI feedback analysis turns open-text survey responses into themes and sentiment drivers. It surfaces which parts of an experience create promoters and where the program needs improvement, at scale, across every market, without manual analysis. Approved customer outcomes that demonstrate this capability include Diageo’s 16-point NPS increase and Leiper’s Fork Distillery cutting management reporting time from a day and a half to 90 minutes.

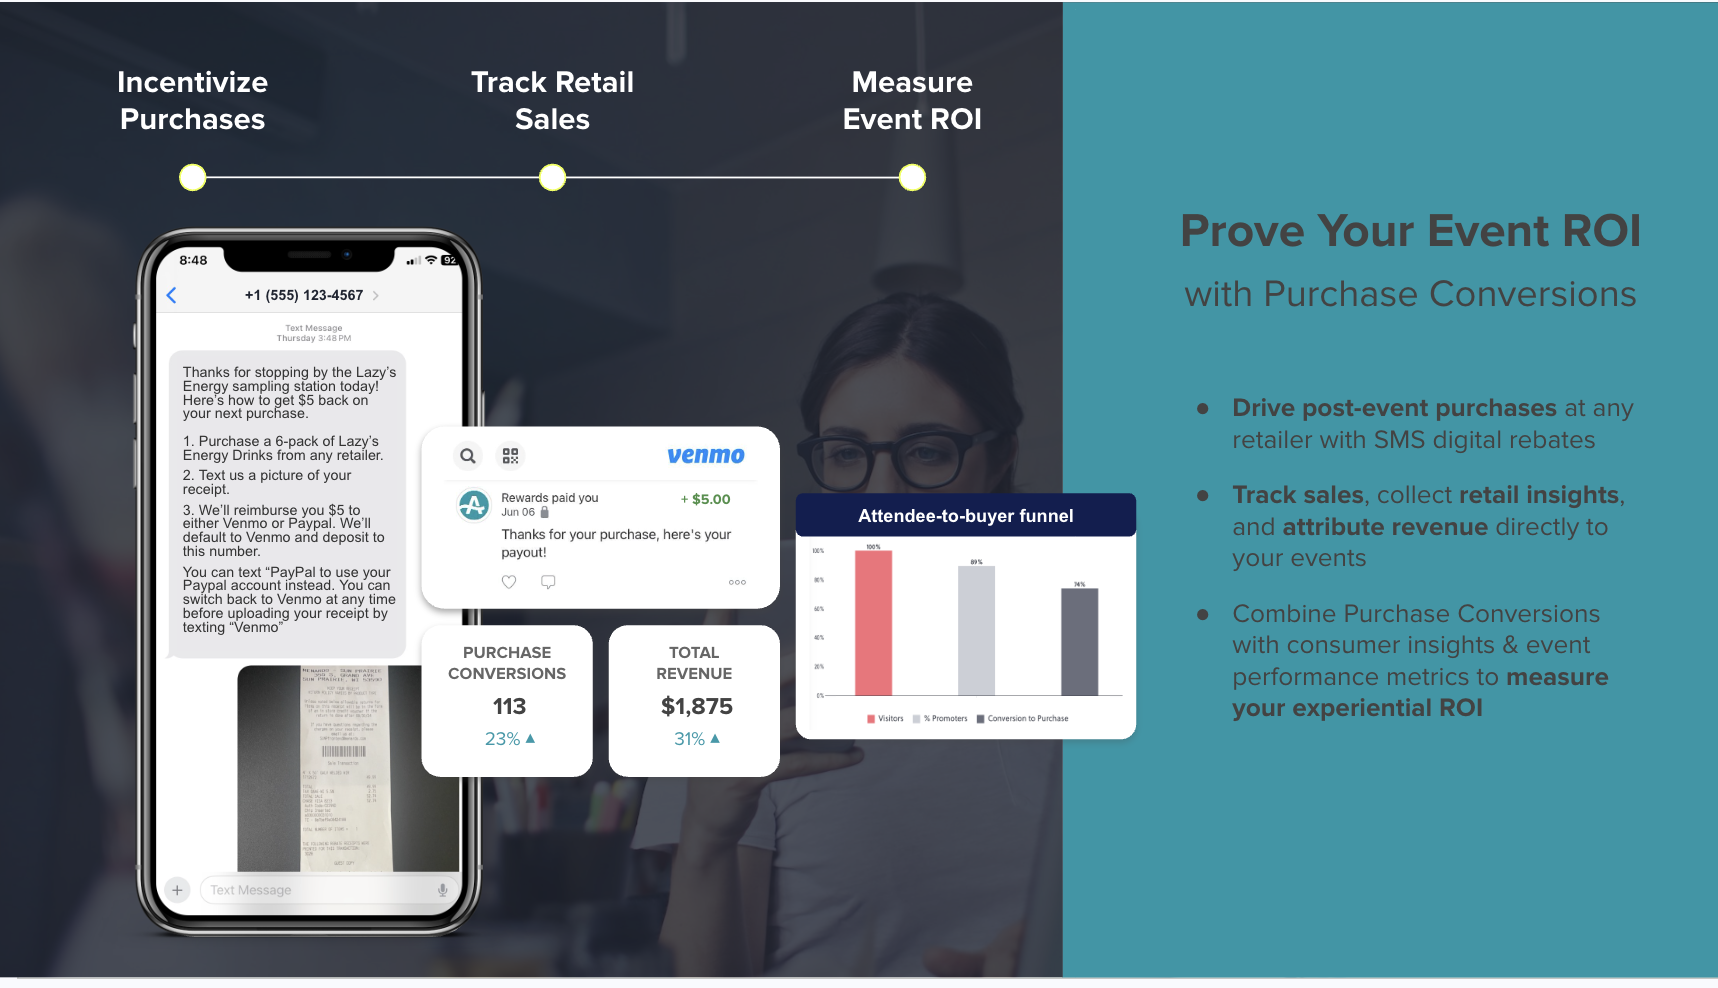
For retail attribution, AnyRoad’s purchase conversion mechanics, including cashback rebates and sweepstakes, connect an activation to a receipt-verified bottle purchase without requiring POS integration. A consumer registers at an activation and receives an SMS with a cashback rebate. They buy the bottle at any retail account, photograph the receipt, and text it back. AnyRoad’s AI reads the receipt, confirms the eligible SKU, and pays the rebate via Venmo or PayPal. Every redemption produces a first-party record tied to a verified purchase, which connects experiential spend to retail sell-through. Absolut’s 36% guest revenue-per-visit lift is one documented outcome of this approach to connecting activation data to commercial results.
For a broader view of how measurement software supports brand activation ROI, see Best Brand Activation Measurement Software for ROI.
How Major Platforms Approach Reporting
AnyRoad is not the only platform in this category, and the alternatives are not interchangeable. Knowing what a national program needs, including structured field capture, clean rollups, downstream routing, and consumer-impact proof, makes it easier to see why platforms diverge. Each one in this category was built around a different primary output, and that origin determines what its reporting is optimized to produce.
MoZeus consolidates campaign, event, and activation performance into a centralized dashboard with side-by-side comparison of markets, venues, retailers, and tour stops. Its reporting covers campaign participation, engagement, opt-ins, and conversions, and it supports multi-agency stakeholder access. MoZeus fits teams whose primary reporting burden is execution visibility across a touring program.
Brandscopic and experienceOS are experiential marketing platforms that include field execution management capabilities such as scheduling, staffing, and activity logging, alongside broader campaign planning, asset management, and reporting functions. They fit programs where the primary output is a field activity report rather than a consumer insight or attribution summary.
MainEvent’s reporting is oriented toward field marketing execution, with dashboards that surface activity counts and compliance metrics. It fits programs where the reporting audience is the field operations team rather than a brand insights or analytics function.
AnyRoad is built for programs where the reporting burden is proving consumer impact and retail attribution. The platform’s consumer-insight layer, including NPS, brand affinity, purchase intent, and PinPoint AI feedback analysis, and its purchase conversion mechanics, including cashback rebates, sweepstakes, and receipt verification, serve brands whose leadership wants to see what an activation did to consumer behavior and commercial results. It fits national brand programs that need to meet the single-dataset standard described earlier and then connect that data to Salesforce, Power BI, or a CRM without manual rework.
What to Require in a Demo
The earlier sections describe what a national program needs; this checklist turns those requirements into questions you can put to any vendor in a live demo. Demand these six capabilities:
- A live rollup dashboard across 20 or more markets, filtered in real time to show how the platform aggregates data across brands, campaigns, markets, cities, venues, and activation dates simultaneously.
- Configurable field forms with GPS coordinates and timestamps embedded in every record at capture.
- Custom KPI reporting that lets the brand define the metrics that matter, including NPS, brand affinity, purchase intent, and cost per engagement.
- Automated executive summaries generated from the same dataset that produces regional and agency-level breakdowns, with no manual rework required to switch between views.
- Multi-agency permissions and access controls that let different agencies see their own markets without accessing data from other partners or other brands.
- Named exports to Excel, Power BI, and Salesforce, with structured data that fits the brand’s existing downstream stack.
Of these six, the live rollup is the one to insist on. Any platform that can only show a screenshot of a rollup has not solved the data architecture problem described at the top of this guide.
Frequently Asked Questions
How Do You Report on National Brand Activations Across Multiple Markets?
National activation reporting requires a platform where field data is captured in a consistent, structured format across every market from the start. The rollup dimensions listed earlier, including brand, campaign, market, city, venue, activation date, and agency or partner, are the ones that matter. When the dataset is structured correctly, one set of data produces an executive summary, a regional breakdown, and a client-ready recap by filtering the same records. Platforms that require manual export and reassembly between views are not built for national scale.
What Should a Brand Activation Recap Report Include?
A complete brand activation recap report includes an executive summary covering campaign dates, markets, total investment, and headline metrics. It also includes market and venue breakdowns showing performance filtered by location and activation date, engagement and insight metrics including NPS, brand affinity, purchase intent, and open-text feedback themes, and attribution data where available, connecting activation records to verified retail purchases or downstream CRM activity. The executive summary should stand alone for decision-makers not involved in day-to-day operations, while the supporting data provides the regional and agency-level detail that field and insights teams need.
How Does Experiential Software Connect to Power BI, Salesforce, or a CRM?
The connection runs through three paths: native integrations, webhooks and API access, and structured exports. The three paths described above each serve a different destination. Native connectors cover the named systems, while webhooks and API handle everything else. Structured exports in Excel or CSV format feed Power BI and other BI tools. The key evaluation question is whether the platform’s data structure is clean enough to enter these systems without a manual transformation step.
How Do You Choose Between Field-Ops-First and Insight-First Platforms?
The choice depends on what the reporting audience needs to see. Field-ops-first platforms are optimized for scheduling, staffing, activity logging, and execution compliance, which suits programs where the primary reporting output is a field activity summary for an operations team. Insight-first platforms are optimized for consumer data capture, NPS and brand affinity measurement, purchase intent tracking, and retail attribution, which suits programs where the primary reporting audience is a brand insights team, a CMO, or a finance team that needs proof of consumer impact and commercial return. National brand programs that need to satisfy both audiences should evaluate whether a single platform can produce both the operational view and the executive insight summary from the same dataset.
Conclusion: Judge Platforms on the Dataset, Not the Dashboard
Judge experiential marketing software by its dataset, not its dashboard. The question is whether one dataset can produce an executive summary, a regional breakdown, and a client-ready recap without manual rework, and then route that data cleanly into Salesforce, Power BI, or Excel. Platforms that solve the field capture problem but not the downstream integration problem leave the manual rework in place. Platforms that produce dashboards but cannot connect activation data to NPS, purchase intent, or retail attribution leave leadership without the proof of consumer impact they need to justify and grow the program.
Prove future retail sales impact from your experiences — book a demo