Written by: Bryan Grobstein, Vice President, Global Revenue, AnyRoad | Last updated: February 24, 2026
Key Takeaways
- Capture data from 100% of event attendees with FullView technology to remove blind spots and establish a clear CLV baseline.
- Apply Event RFM segmentation to find high-value repeat attendees who show 20% higher lifetime value.
- Use AI like PinPoint to analyze feedback in real time and uncover experience elements that drive retention and purchases.
- Automate personalized post-event journeys and triggers that increase repeat revenue through targeted offers and integrations.
- Measure CLV improvements with cohort analysis and dashboards; schedule an AnyRoad demo to put this 7-step playbook into action.
Step 1: Capture Complete Event Data with FullView
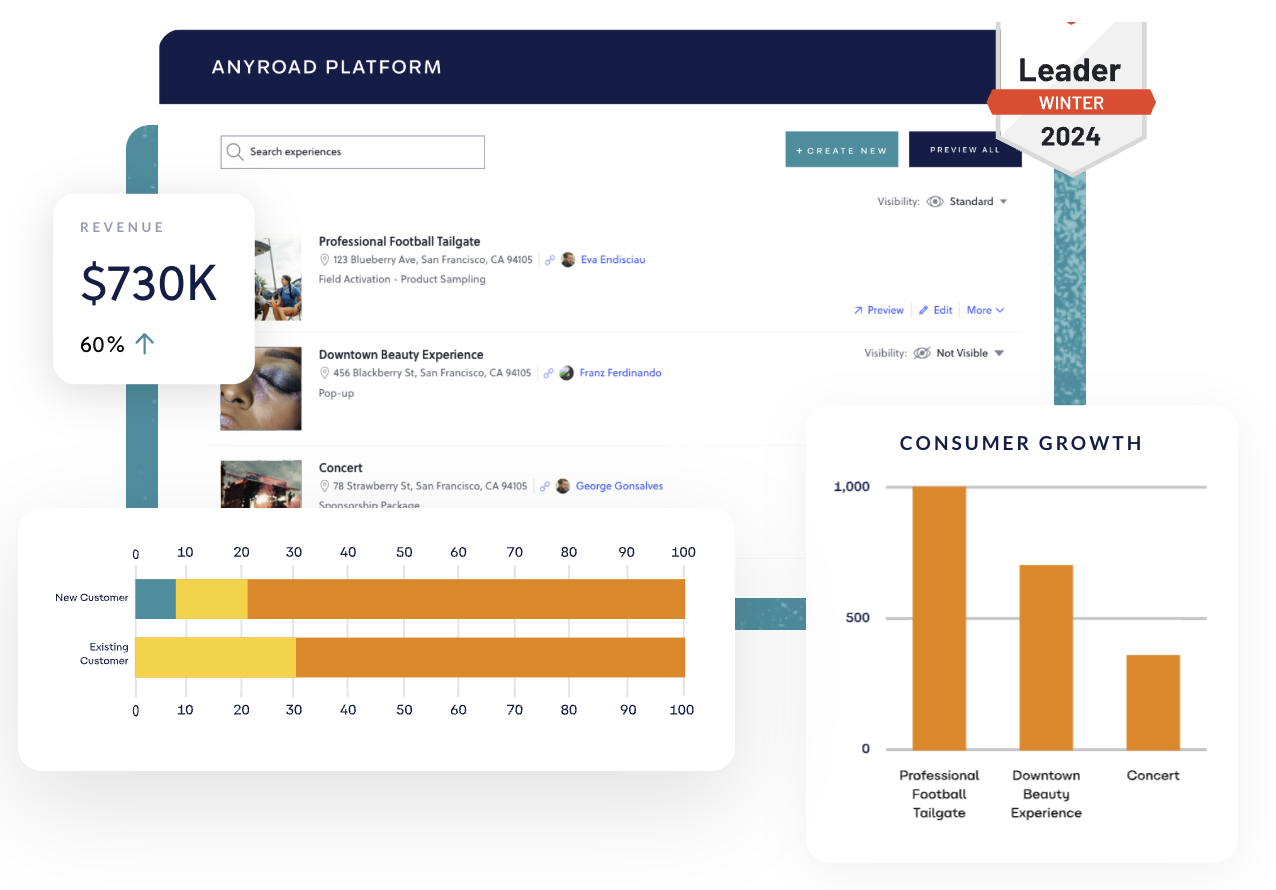
Customer lifetime value growth starts with complete data from every event touchpoint. Traditional booking systems only collect information from the person who makes the reservation, which hides valuable data from the rest of the group. AnyRoad FullView technology fixes this gap by capturing demographics, preferences, and contact information from every participant, not just the booking contact.
For tastings and tours, track attendance patterns, demographic profiles, purchase behavior during events, and engagement levels. This baseline data forms the starting point for measuring CLV improvements over time. Brands that capture comprehensive data quickly improve audience segmentation and deliver more relevant follow-up communications.
Generic platforms like Eventbrite focus mainly on ticket sales and basic registration. FullView goes deeper for CLV analysis. The technology integrates directly into your website, keeps the brand experience consistent, and gathers rich first-party data that flows into your CRM and marketing automation systems.
Step 2: Use Event RFM to Segment by Attendance and Behavior
Apply RFM segmentation to event data by analyzing Recency, Frequency, and Monetary value. Recency tracks how recently guests attended. Frequency tracks how often they participate. Monetary value tracks how much they spend during events. Brands using advanced personalization achieve 20% higher LTV by spotting high-value segments early in the journey.
Event RFM reveals clear patterns. Recent tour participants show higher engagement rates. Repeat attendees deliver about 20% higher lifetime value. Guests who purchase during experiences often become your most valuable customers. This segmentation supports targeted campaigns that speak directly to each group’s behavior.
AnyRoad analytics dashboards surface insights into attendance, demographics, brand affinity, NPS, and purchase intent. Basic booking tools like FareHarbor lack this level of data depth. With AnyRoad, you can flag VIP guests, at-risk customers, and high-potential prospects, then build tailored engagement strategies for each group.
Step 3: Turn Feedback into Insights with PinPoint AI
AI-powered analysis converts qualitative feedback into clear, quantitative insights. PinPoint processes thousands of survey responses, reviews, and feedback forms to uncover themes, sentiment drivers, and practical recommendations. Real-time analytics is becoming the standard in 2026, with 75% of enterprise data processed using event-driven architectures for instant insights.
For tours and tastings, AI highlights which experience elements drive positive sentiment. It flags operational issues before they hurt NPS scores and reveals opportunities for premium add-ons. These findings connect directly to retention and future purchase behavior.
PinPoint processes feedback in real time, so teams can adjust experiences while guests are still on-site. This responsiveness creates memorable moments that increase loyalty, referrals, and long-term CLV.
Step 4: Build Personalized Post-Event Journeys
Event data should power personalized follow-up sequences that turn attendees into loyal customers. Email subscribers have a 320% higher customer lifetime value than non-subscribers, so post-event email programs become a major CLV driver.
Segment communications based on event behavior. Send premium experience invitations to high spenders. Share educational content with first-time visitors. Offer exclusive deals to repeat attendees. AnyRoad connects with platforms like HubSpot and Klaviyo to trigger these journeys automatically.
Personalization should extend beyond email. Use SMS for time-sensitive offers, social media retargeting for awareness and reminders, and direct mail for top-value segments. Match each message and channel to the customer’s preferences and value potential.
Step 5: Set Automated Triggers for Repeat Revenue
Automated workflows turn event participation patterns into repeat purchases and bookings. Companies using workflows achieve 505% return over three years by automating lead nurturing and retention.
Configure triggers for post-tasting cashback offers, loyalty program enrollment, and exclusive event invitations. A guest who attends a whiskey tasting can receive a bottle discount code within 48 hours. Tour participants can receive invitations to members-only or seasonal events.
Integrations with payment platforms like Stripe and point-of-sale systems allow you to tie these conversions back to the original event. This connection gives clear ROI measurement for experiential marketing investments.
Step 6: Connect Event Feedback to CLV Metrics
Event feedback scores should link directly to long-term customer value. Track how NPS from events aligns with future purchase behavior, retention, and referrals. This connection proves the financial impact of experience quality.
Monitor metrics such as time between event attendance and first purchase, average order value for event attendees versus non-attendees, and lifetime value across different feedback score ranges. These insights support smart investments in experience upgrades and premium offerings.
Use cohort analysis to compare event attendees over 12, 24, and 36 months with customers from other channels. This long-term view shows how experiential marketing sustains value over time.
Step 7: Use Dashboards to Measure and Scale CLV Gains
Comprehensive dashboards keep CLV improvements visible and actionable. Track data capture rates, segmentation performance, personalization results, and revenue attribution from events to retail or ecommerce sales.
Set regular review cycles to identify which events, experiences, and follow-up strategies deliver the highest CLV. Use these findings to refine future programming and shift budget toward the most effective experiential touchpoints.
Roll out successful strategies across locations and event types while protecting data quality and personalization. AnyRoad’s centralized platform supports consistent execution across brand portfolios and still allows local teams to customize experiences.
Pro Tips to Avoid CLV Data Gaps
Several common mistakes limit CLV gains from event data. Many brands ignore group attendee data beyond the booking contact and lose 60–70% of potential customer relationships. FullView technology closes this gap by capturing information from every participant.
Low opt-in rates also hurt many experiential programs. Compliance-friendly ID scanning and clear value exchanges can significantly increase data capture. Leading brands reach 30% data capture rates and see 16-point NPS lifts through consistent feedback collection and follow-up.
How to Track CLV Using Event Data
Start by calculating baseline CLV for event attendees. Track purchase frequency, average order value, and retention over a 24-month period. Compare these metrics with customers from other channels to quantify the premium created by experiential marketing.
Common RFM Mistakes in Event Programs
Avoid treating every event the same in RFM calculations. Assign higher monetary weight to premium experiences and adjust recency scores for seasonal patterns. Include group bookings correctly in frequency metrics so segmentation stays accurate.
Real-World Case Studies: AnyRoad CLV Wins
Absolut used AnyRoad data to secure larger budgets for premium experiences and increased guest revenue per visit by 36%. Proximo Spirits discovered missing contact information for more than 66% of guests and started collecting 69% more data with FullView. Sierra Nevada reached an 85% brand conversion rate after events and consistently creates new brand champions through data-driven experience improvements.
These outcomes show how systematic event data analytics can raise customer lifetime value across many types of experiential programs.
Conclusion: Grow CLV with Event Data Mastery
This 7-step playbook turns event data into a strategic growth engine and supports 25–95% profit improvements through stronger retention. As 2026 moves toward real-time analytics and predictive CLV modeling, platforms like AnyRoad with PinPoint AI give brands a clear edge in experiential marketing.
AnyRoad serves as a leading platform for experiential CLV growth by combining complete data capture, AI-driven insights, and integrations that prove ROI from every event. Ready to boost CLV from events? Book a demo.
Frequently Asked Questions
How quickly can brands see CLV improvements from event data analytics?
Most brands see early improvements within 3–6 months of launching comprehensive event data analytics. The exact timing depends on event frequency and the maturity of follow-up automation. Brands with monthly events and automated nurture sequences often see measurable CLV gains in the first quarter. Brands with seasonal programs may need 6–12 months to build clear trends. Consistent data capture and structured follow-up create compounding results over time.
What is the minimum event volume needed for meaningful CLV insights?
Meaningful CLV analysis usually requires at least 500 event attendees over six months to build statistically reliable patterns. Brands can still collect useful data from day one and use early findings to refine experiences while they grow sample size. Data quality matters more than raw volume. Rich, accurate data from 200 attendees beats basic contact details from 1,000 participants.
How do you handle privacy compliance while maximizing event data collection?
Effective event data collection balances depth with privacy compliance. Use transparent opt-in language, clear value exchanges, and secure data practices. In regulated industries, use ID scanning for age checks and collect marketing preferences separately. Offer instant value, such as exclusive content or discounts, in exchange for detailed information. Ensure all processes comply with GDPR, CCPA, and industry rules while still supporting CLV analysis.
What integrations are essential for connecting event data to CLV measurement?
Core integrations include CRM systems for lifecycle tracking, email platforms for automated nurture, point-of-sale systems for purchase attribution, and analytics tools for reporting. The event platform should support both API connections and webhooks to keep data flowing in real time. Advanced setups also connect to CDPs for unified profiles and BI tools for executive-level experiential ROI reporting.
How do you measure the incremental impact of event data analytics on CLV versus other channels?
Use cohort analysis to compare CLV for event attendees with customers from other channels over the same time windows. Track purchase frequency, average order value, retention, and referral behavior across 12, 24, and 36 months. Apply attribution models that reflect multi-touch journeys while isolating the role of experiential touchpoints. For deeper accuracy, use control groups and incrementality tests to measure the true lift from event data analytics.