


Written by: Bryan Grobstein, Vice President, Global Revenue, AnyRoad
Key Takeaways
- Experiential marketing attribution is structurally harder than digital because live events occur offline and most stacks cannot connect an activation to later retail purchases or loyalty enrollments.
- Eight leading methods, including direct tracking, incrementality testing, multi-touch attribution, marketing mix modeling, brand lift studies, engagement metrics, matched market testing, and lifetime-value attribution, address different gaps and work best when combined.
- Alcohol brands face extra compliance hurdles: age verification at every data-capture point, licensed-retailer routing for club sales, and privacy-safe measurement that does not rely on third-party cookies.
- Practical pilots show that capturing first-party records from every attendee, not just the booking lead, and linking those records to verified purchases or club enrollments produces the clearest revenue signal.
- AnyRoad’s platform unifies data capture, compliant promotions, and loyalty tracking so brands can turn every activation into measurable lifetime value. See the platform in a live demo.
Executive Overview: Why Experiential Attribution Is Different
Marketing attribution assigns measurable credit to the touchpoints that produce a conversion, such as a purchase, an enrollment, or a loyalty opt-in. Digital campaigns rely on online signals, so attribution is imperfect but manageable. Experiential campaigns are structurally harder because the activation happens offline, the consumer may purchase days or weeks later through a channel the brand does not own, and the data capture window exists only during the live experience.
Offline-to-online measurement faces three compounding obstacles. First, by mid-2026 Chrome continues to offer third-party cookies by default while Safari, Firefox, and Brave block them, which limits the retargeting and attribution chains brands once used to follow a consumer from an event to a purchase. Second, multi-touch attribution degrades badly against the offline interactions it cannot see, so it cannot stand alone for experiential campaigns. Third, most brands capture data only from the person who booked the experience and miss the majority of attendees entirely.
The eight methods below address these gaps from different angles. No single method is sufficient. The decision framework in the Strategic Considerations section explains how to combine methods based on budget, event type, and compliance constraints.
Explore how AnyRoad’s platform handles offline-to-online measurement in a live demo.
Industry Landscape: Why New Methods Are Required
The measurement environment for experiential marketing has shifted materially since 2024. Post-cookie attribution has moved from deterministic user-level stitching toward modeled, privacy-aware approaches such as marketing mix modeling, incrementality testing, and server-side tracking. Google retired the Privacy Sandbox in October 2025, eliminating the Attribution Reporting API and accelerating reliance on first-party and modeled methods.
At the same time, the business case for experiential investment has strengthened. Recent industry research indicates that many consumers are more inclined to purchase after an event, and reports suggest that event-sourced leads often show strong conversion rates. Brands now need attribution methods that work in a privacy-first, post-cookie world and that reflect this growing experiential impact.
The gap in existing measurement guides is clear. Most address digital attribution exclusively. Few deliver an experiential-specific decision framework, address alcohol compliance constraints on data capture, or connect attribution outputs to bottle club revenue and lifetime loyalty programs. This guide fills that gap and prepares you to evaluate which of the eight methods will work for your program.
See AnyRoad’s experiential attribution capabilities in action in a tailored walkthrough.
Core Components: Eight Practical Attribution Methods
1. Direct Tracking: Connecting Attendees to Purchases
Direct tracking assigns conversion credit by following an identifiable consumer from the moment of activation through to a downstream purchase or enrollment. In an experiential context, this means capturing a first-party record at the event via QR code scan, form fill, or ID verification, then matching that record to a subsequent transaction in a CRM, POS system, or ecommerce platform.
Implementation requires a data capture mechanism at every attendee touchpoint, not just the booking confirmation. It also requires a unique identifier that persists across channels and an integration between the event platform and the downstream transaction system. Point-of-sale system integration tags transactions originating from event attendees to enable direct attribution of sales to experiential activations.

| Dimension | Pros | Cons |
|---|---|---|
| Accuracy | Deterministic, ties a named individual to a verified purchase | Works only for attendees whose data was captured at the event |
| Complexity | Straightforward with a unified event platform | Requires POS or ecommerce integration and breaks when data capture is incomplete |
2. Incrementality Testing: Proving Causal Lift
Incrementality testing measures the causal lift an activation produces by comparing a test group exposed to the experience against a matched control group that was not. For experiential campaigns, this usually means geo experiments. One market receives the activation, a comparable market does not, and analysts compare retail sales data across both over a defined window.
Incrementality testing via geo experiments has surged for offline marketing channels like live events, with analysts setting up test markets and comparing them against similar control regions to prove causation. A published dataset of 225 geo-based incrementality tests run between August 2024 and December 2025 reported a median incremental return on ad spend of 2.31x, and 88.4% of tests reached statistical significance.
| Dimension | Pros | Cons |
|---|---|---|
| Causation | Establishes true causal lift, not correlation | Requires sufficient market scale and budget to reach statistical significance |
| Privacy | Does not depend on user-level tracking or cookies | Results lag the activation by weeks and are not useful for in-flight changes |
3. Multi-Touch Attribution (MTA): Sharing Credit Across Channels
Multi-touch attribution distributes conversion credit across multiple touchpoints in a consumer journey, using first-touch, last-touch, linear, time-decay, or data-driven weighting. For experiential campaigns, MTA helps when the live event is one touchpoint in a longer digital journey that includes email follow-up, retargeting, and ecommerce.
Many multi-touch attribution systems now miss between 30 and 60 percent of actual customer touchpoints depending on channel mix, audience demographics, and mobile traffic share, so MTA should serve as a directional input rather than a definitive measure for experiential campaigns.
| Dimension | Pros | Cons |
|---|---|---|
| Channel coverage | Credits the event alongside digital touchpoints in a unified model | Cannot observe offline interactions and systematically undercounts experiential influence |
| Actionability | Useful for improving post-event digital follow-up sequences | Correlation-based and does not prove the event caused the conversion |
4. Marketing Mix Modeling (MMM): Guiding Annual Budget Decisions
Marketing mix modeling uses aggregate historical data such as sales, spend, seasonality, pricing, and distribution to estimate each channel’s contribution to revenue. MMM does not require user-level tracking, which makes it one of the most privacy-resilient methods available. Marketing mix modeling allocates budget across the full channel mix including offline channels, serving as a key complement to digital attribution when privacy changes limit user-level visibility.
For alcohol and CPG brands running recurring activation programs, MMM is the right tool for annual budget allocation decisions. It requires at least 12 months of clean sales data and is typically run by a specialist analyst or agency.
| Dimension | Pros | Cons |
|---|---|---|
| Privacy | No user-level data required and fully cookie-independent | Cannot attribute impact to individual events or activations |
| Strategic value | Informs channel budget allocation across the full mix | Requires substantial historical data and produces retrospective results |
5. Brand Lift Studies: Measuring Upper-Funnel Impact
Brand lift studies measure shifts in awareness, consideration, purchase intent, and NPS among consumers exposed to an activation versus a matched control group. They are the standard method for quantifying upper-funnel impact when direct sales attribution is not feasible, such as at a festival where no purchase opportunity exists on-site.
Studies from Kantar and Google on live events have shown positive impacts on brand awareness and purchase intent. AnyRoad’s Atlas Insights dashboard tracks NPS, brand affinity, and purchase intent as standard post-experience metrics, which enables brand lift measurement without a separate research vendor.

| Dimension | Pros | Cons |
|---|---|---|
| Applicability | Works for any activation type, including those with no on-site purchase | Measures intent, not verified purchase behavior |
| Speed | Results available within days of the event | Survey fatigue and self-report bias can inflate intent scores |
6. Engagement Metrics: Using Leading Indicators
Engagement metrics such as check-in rates, dwell time, experience completion rates, NPS, social shares, and email open rates from post-event sequences act as leading indicators of downstream conversion. These metrics do not prove revenue impact on their own. They do show which activations and experience formats produce the most engaged attendees, which allows teams to refine programs before a full sales attribution cycle completes.
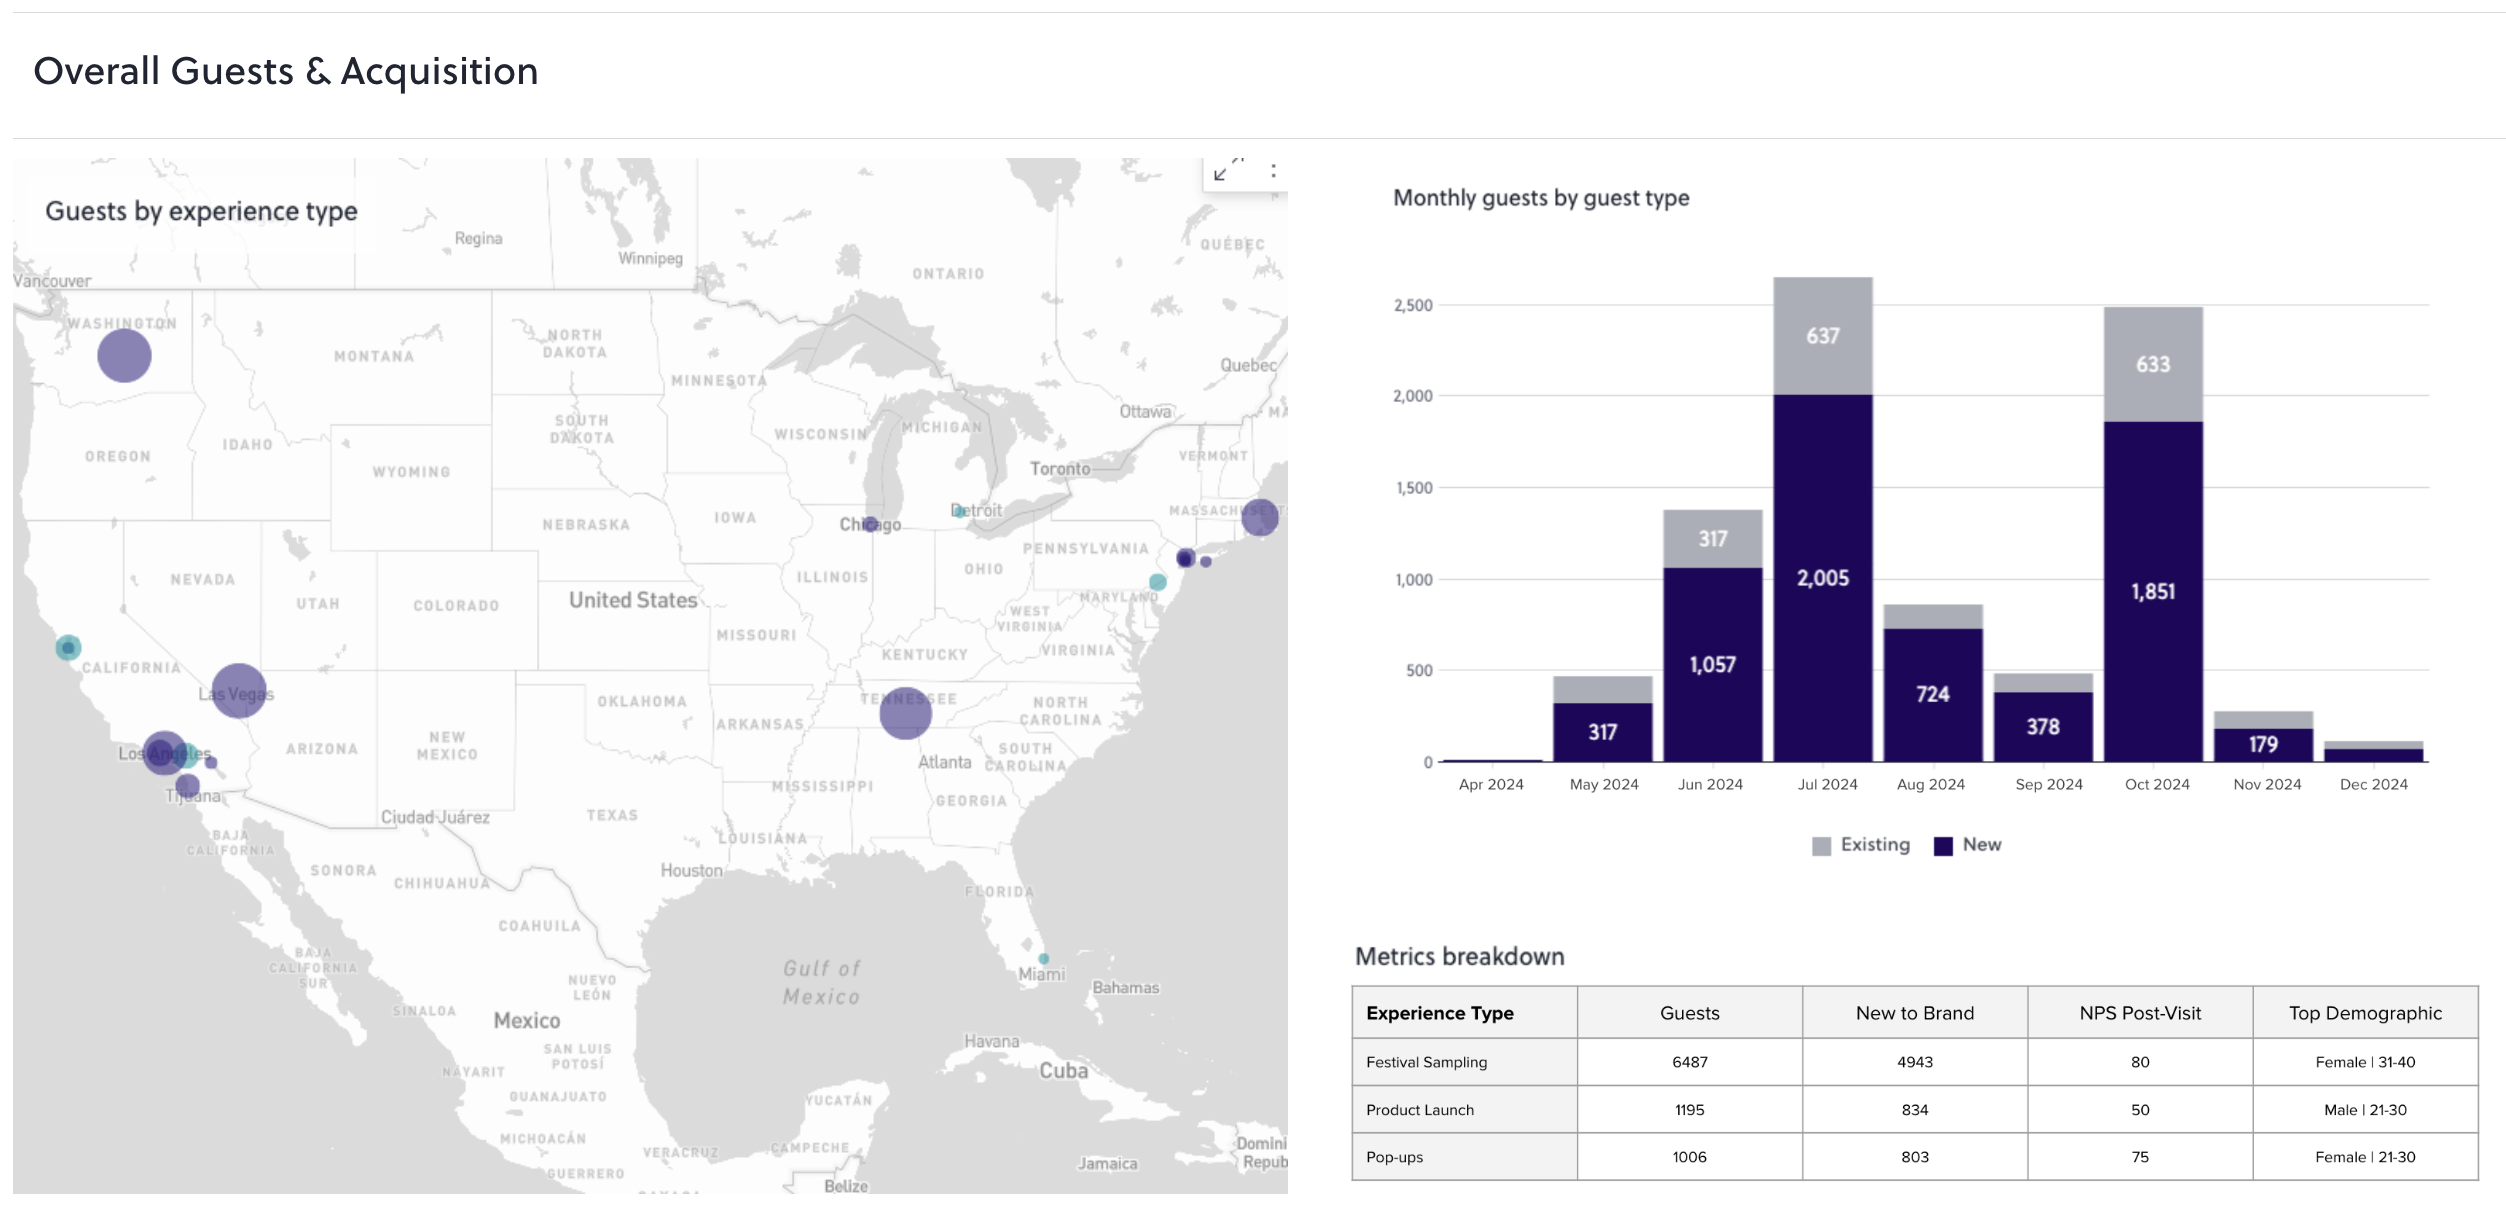
Experiential campaigns should track leading indicators such as active physical engagement rates above 40% and new email subscribers as early proxies before tying them to downstream sales.
| Dimension | Pros | Cons |
|---|---|---|
| Speed | Available in real time and enables in-event and post-event adjustments | Engagement does not equal revenue and high NPS does not guarantee purchase |
| Data requirements | Requires only a data capture mechanism at the event | Metrics are relative and benchmarks vary by category and format |
7. Matched Market Testing: Building Board-Ready Proof
Matched market testing is a structured variant of incrementality testing. The analyst selects geographically or demographically comparable markets before the activation, runs the program in one set of markets, withholds it from the other, and compares retail velocity across both. This method provides the most rigorous causal proof available for field marketing programs and suits alcohol brands with regional distribution footprints.
An Environics Analytics study found that 90% of CPG campaigns drove measurable sales lift, with an average incremental sales increase of 19%. Matched market testing produces the defensible, board-ready number behind that kind of claim.
| Dimension | Pros | Cons |
|---|---|---|
| Rigor | Gold-standard causal proof that is defensible to finance and leadership | Requires pre-planned market selection and cannot be retrofitted after the activation |
| Scale | Works for regional and national programs with sufficient market pairs | Not practical for single-market or one-off activations |
8. Lifetime Value and Loyalty Attribution: Focusing on Members
Lifetime value and loyalty attribution measures the revenue a consumer generates across their entire relationship with the brand, not just the first transaction. For alcohol brands, this method is strategically critical. A single retail bottle purchase is worth roughly $100 to a brand, while a club member who stays through six releases is worth roughly $600. The attribution question shifts from “did this event drive a purchase?” to “did this event produce a member?”
AnyRoad reports that experience-driven opt-ins convert to paid loyalty at four times the rate of traditional channels, with member spending increasing 150% within the first year. A consumer who visits a distillery twice is 512% more likely to convert into a paid loyalty enrollment, which makes the second visit the most important attribution signal in the entire funnel.
| Dimension | Pros | Cons |
|---|---|---|
| Revenue impact | Captures the full $600 member value, not just the first $100 transaction | Requires a loyalty program infrastructure to generate the data |
| Retention insight | Identifies churn inflection points, such as the six-release mark, for intervention | Uses a long measurement window, so results are not available immediately post-event |
See how AnyRoad connects every activation to lifetime member value in a platform demo.
Strategic Considerations: Choosing the Right Mix
The right attribution method depends on three variables. These include whether the program is B2B or B2C, whether alcohol compliance constraints apply to data capture and promotions, and whether the brand has the internal capability to build and maintain the measurement stack.
B2C experiential programs such as distillery tours, festival activations, and ambassador tastings involve high volumes of individual consumers with short purchase cycles. Direct tracking, brand lift studies, and LTV attribution serve as the primary methods. B2B experiential marketing, by contrast, prioritizes depth and quality of interaction with a smaller, high-value audience. Attribution then shifts toward pipeline contribution and account-level engagement quality tracked through CRM integrations with platforms like Salesforce or HubSpot.
Alcohol compliance introduces constraints that generic attribution guides ignore. Age verification is mandatory at data capture, so any QR-code or form-fill mechanic must include an embedded age gate. Promotional mechanics such as sweepstakes and cashback rebates require terms and conditions and privacy policies that satisfy federal and state regulation. Any club or subscription model requires a licensed retailer in the transactional path because the brand cannot ship product directly. AnyRoad’s platform handles age verification via integrated ID scanning, manages sweepstakes compliance, and routes club transactions through a licensed ecommerce retail partner.
The build-versus-partner decision is straightforward for most alcohol brands. Many CPG brands report limited confidence in their measurement of retail activations, which reflects the cost and complexity of assembling a compliant, integrated measurement stack internally. A purpose-built experiential platform that combines data capture, attribution analytics, loyalty enrollment, and managed CRM removes the multi-vendor fragmentation that creates that confidence gap.
Discuss which attribution methods fit your compliance requirements in a consultation with our team.
Implementation and Readiness: Four-Phase Rollout
A four-phase rollout converts the eight-method framework into a working measurement program that your team can operate consistently.
- Audit current data. Inventory every event type in the portfolio, identify which ones currently capture first-party attendee records, and quantify the data gap. Brands that capture data only from the booking lead, not every attendee in the group, are typically missing more than two-thirds of their audience. AnyRoad’s FullView feature captures data from every individual in a group booking, not just the person who reserved.
- Select pilot events. Choose two to three activations that represent different formats, such as a brand home tour, a field ambassador tasting, and a festival activation, and that have sufficient volume to generate statistically meaningful results. Pair each with a control market or a pre and post measurement window of at least 30 days before and 90 days after.
- Integrate tools. Connect the event platform to the downstream systems where conversions are recorded, including CRM systems such as Salesforce or HubSpot, ecommerce platforms such as Shopify, email automation tools such as Klaviyo, and retail sales data. Connecting event management software directly with marketing automation tools creates a single source of truth for all consumer engagement metrics and reduces manual data entry errors.
- Measure and iterate. Run the pilot and collect engagement metrics in real time to identify which activations generate the highest attendee engagement. Then complete the full sales attribution window, typically 90 days post-event, before drawing conclusions about revenue impact, since engagement alone does not prove conversion. Use the results to calibrate the attribution model by adjusting the weighting between direct tracking, brand lift, and LTV attribution before scaling to the full activation calendar.
Walk through AnyRoad’s experiential attribution implementation process with a platform specialist.
Common Pitfalls: Four Patterns That Distort Results
Four failure modes account for most attribution programs that produce inconclusive or misleading results.
Over-reliance on single-touch models. Last-click attribution assigns all credit to the final digital touchpoint before purchase, which systematically erases the contribution of the live event that initiated the consumer relationship. Single-touch attribution models assign all conversion credit to one interaction, while multi-touch models share the credit across several interactions in the customer journey. For experiential campaigns, neither approach is sufficient alone. The eight-method framework exists because no single model captures the full picture.
Ignoring depletion-driven churn. Club and membership programs that measure only enrollment volume miss the most important retention signal. Members who have not consumed their current allocation begin skipping and pausing releases, with churn concentrating around the inflection point identified earlier. When members do not consume their bottles, they lose the experiential connection that drives renewal and feel as if they are paying for product they have not used rather than for an ongoing brand relationship. The attribution implication is that a program showing strong enrollment numbers may be generating far less than the projected $600 LTV per member if depletion is not tracked and addressed through programming.
Failing to capture data from every attendee. A brand that captures data only from the booking lead and not from every individual in the group is running attribution on a fraction of its actual audience. The data gap is not random. It systematically excludes the guests who did not initiate the booking, who may include the highest-value consumers in the group.
Stitching non-compliant stacks. Assembling an ecommerce provider, subscription billing software, a fulfillment partner, and an email platform without alcohol-native compliance expertise produces a program that is operationally fragile and legally exposed. Privacy regulations such as GDPR in the EU and CCPA in the US have led to lower consent rates for tracking cookies, which renders a substantial portion of traffic invisible to cookie-based attribution before ad blockers are considered. That compliance gap compounds when the data capture mechanic itself is not designed for a regulated industry.
See how AnyRoad’s experiential attribution platform avoids these pitfalls by design.
Practical Examples: How Brands Apply These Methods
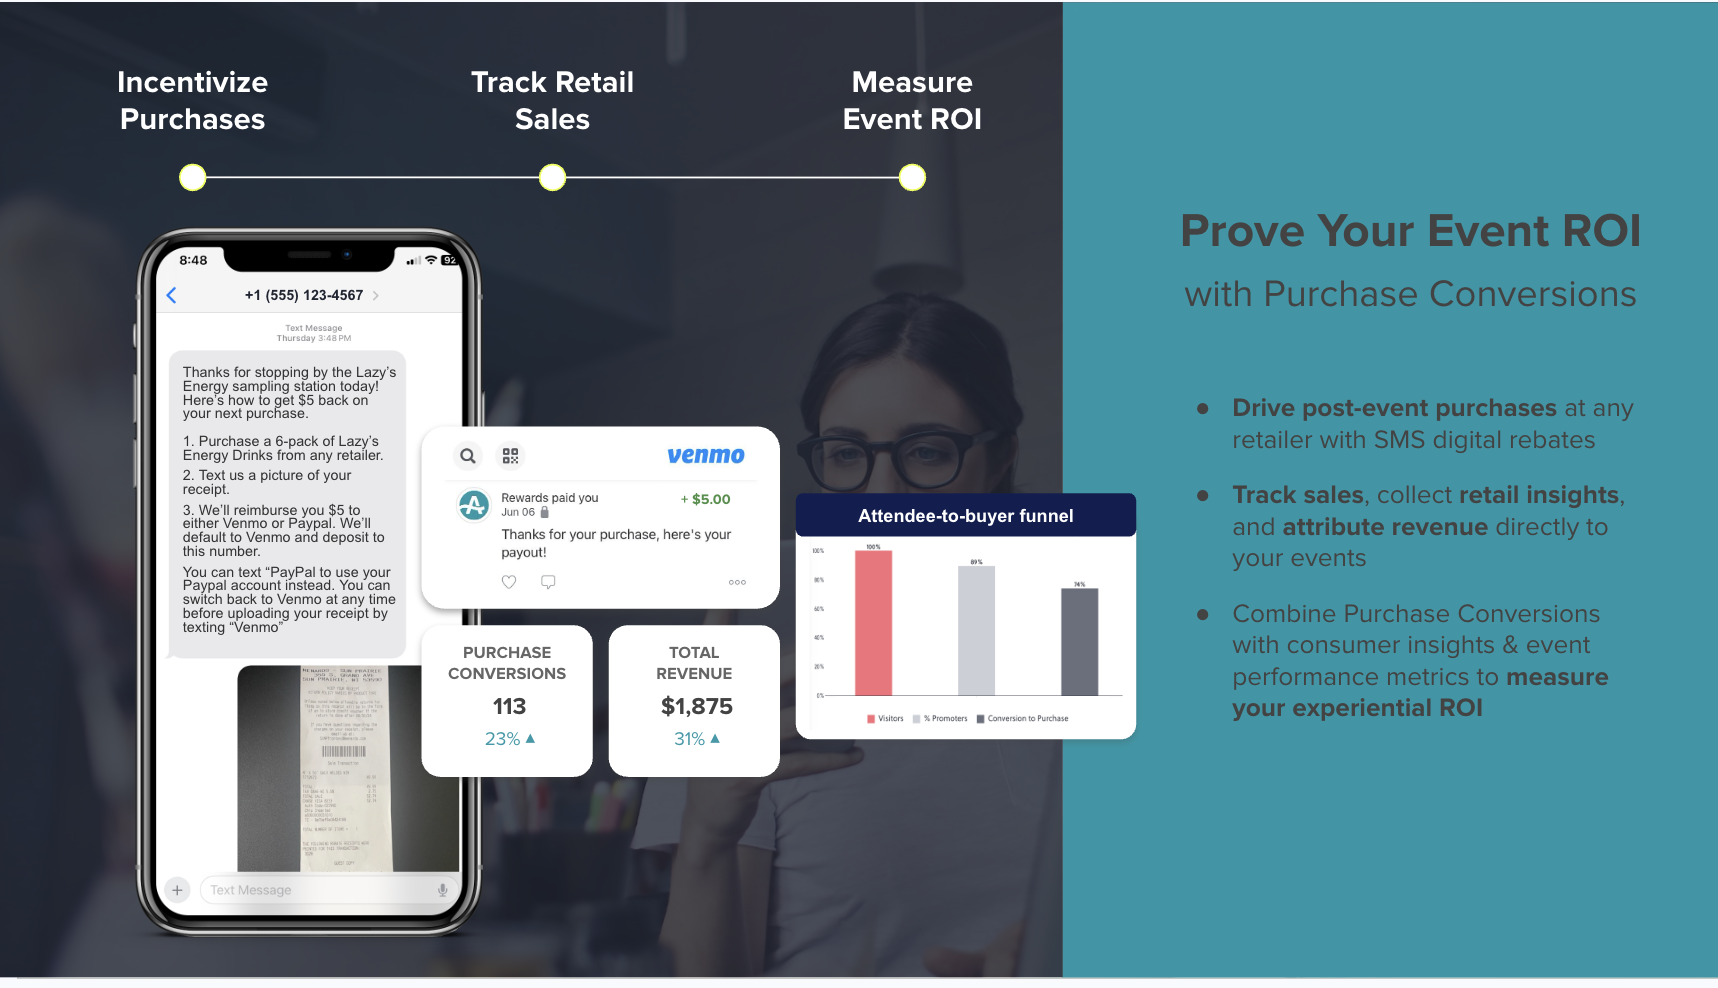
Ambassador tasting program. A craft spirits brand runs weekly ambassador tastings inside third-party retail accounts. Historically, the only output was a depletion report that showed units moved from the shelf during the tasting window, with no line connecting the activation to a named consumer or a future purchase. After deploying AnyRoad Live, the brand’s ambassadors present a QR code at each tasting. Consumers register on the spot, receive an SMS with a cashback rebate redeemable anywhere the product is sold, photograph their receipt after purchase, and submit it for payment via Venmo or PayPal. AnyRoad’s AI reads the receipt, confirms the eligible SKU, and closes the attribution loop with a first-party record tied to a verified purchase. In a one-month pilot with a single unnamed craft brand on a small dataset, 56% of the records collected converted to a bottle purchase, which illustrates the mechanic rather than a platform-wide benchmark. Every record captured feeds directly into the brand’s CRM for follow-up segmentation and loyalty enrollment outreach.
Distillery tour series. A heritage distillery runs a tiered tour program that includes a standard tour, a premium tasting experience, and a master distiller session priced at approximately $20, $50, and $150 respectively. AnyRoad’s FullView feature captures a first-party record from every individual attendee, not just the booking lead, including age verification via integrated ID scanning. Post-visit, the platform’s Atlas Insights dashboard surfaces NPS by experience tier, purchase intent scores, and visit frequency by consumer segment. Guests who have visited twice are identified as high-probability club enrollment candidates, consistent with the 512% conversion lift documented earlier. Tour guides, coached by AnyRoad’s on-site team, make the club enrollment pitch at the end of the master distiller session, paired with a same-day enrollment discount. Enrolled members are tracked through the club’s release calendar, with churn intervention programming such as virtual cocktail classes with master distillers deployed at the five-release mark to protect the $600 LTV established earlier. Diageo’s Johnnie Walker Princes Street experience demonstrated that AnyRoad analytics could show a historically under-targeted demographic was 40% more likely to drink whisky after visiting, which reflects the same attribution logic applied to club enrollment targeting.
See how AnyRoad’s attribution methods apply to your specific activation formats in a customized demo.
Frequently Asked Questions
What is the difference between incrementality testing and multi-touch attribution for experiential campaigns?
Multi-touch attribution distributes credit across the touchpoints a tracking system can observe, which for experiential campaigns typically means digital touchpoints before and after the event but not the event itself. It measures correlation, so it shows that consumers who attended were more likely to convert but cannot prove the event caused the conversion. Incrementality testing establishes causation by comparing a test group exposed to the activation against a matched control group that was not. For experiential campaigns, incrementality testing is the more reliable method for proving that the activation drove incremental sales above what would have occurred without it. The two methods are complementary. MTA improves the digital follow-up sequence, while incrementality testing defends the budget to leadership.
How do alcohol compliance requirements affect first-party data capture at live events?
Alcohol brands face two layers of compliance at live events. The first is age verification. Any data capture mechanic, including QR codes, form fills, or tablet registration, must include an age gate that satisfies the legal drinking age requirement in the relevant jurisdiction. Integrated ID scanning, as offered by AnyRoad, embeds this verification into the check-in flow rather than treating it as a separate step. The second layer applies to promotional mechanics. Cashback rebates and sweepstakes require terms and conditions, privacy policies, and in some states specific regulatory filings. Any club or subscription model requires a licensed retailer in the transactional path because the brand itself cannot legally ship alcohol in most jurisdictions. A purpose-built experiential platform designed for alcohol handles these requirements by default, while a generic event tool does not.
What attribution method is most effective for connecting a distillery visit to a bottle club enrollment?
Lifetime value and loyalty attribution is the primary method, supported by direct tracking. The mechanism works as follows. A first-party record is captured from every attendee at the visit. The record is enriched with NPS, spend, and visit frequency data. Consumers who have visited twice are flagged as high-probability enrollment candidates. The enrollment pitch is made on-site by a coached staff member, and the resulting club member is tracked through the full release calendar. Attribution is deterministic because the record from the visit is the same record that becomes the club enrollment. The LTV metric, which values six releases at $600 versus $100 for a single bottle purchase, provides the revenue figure that justifies the activation spend. Engagement metrics from the visit, including NPS and experience tier selection, serve as leading indicators of enrollment likelihood and help teams prioritize which guests receive the enrollment pitch.
How should brands handle attribution when activations occur inside third-party retail accounts with no POS integration?
The cashback rebate mechanic solves this problem without requiring any retailer integration. The consumer registers at the activation via QR code, receives an SMS with a rebate offer, purchases the product at any retail or on-premise account, photographs the receipt, and submits it for payment. The receipt serves as the attribution signal because it identifies the SKU, the retailer, and the purchase date, which creates a first-party record tied to a verified transaction. This approach works across any account, including a Total Wine ambassador tasting, a bar activation, or a grocery store sampling, without asking the retailer to modify their POS system. The result is a closed-loop attribution record that replaces the depletion report as the measure of whether the activation drove a sale.
What is the right attribution model for a brand that runs both brand home experiences and field activations?
A triangulated approach fits this scenario. Direct tracking and LTV attribution apply to brand home experiences where data capture is controlled and club enrollment is the conversion goal. Incrementality testing or matched market testing applies to field activations where the conversion happens at retail. Marketing mix modeling runs annually to allocate budget across both program types. Brand lift studies complement these methods for any activation format where direct sales attribution is not feasible within the measurement window. The key operational requirement is a unified data layer. A single platform must capture first-party records from both brand home and field activations and connect them to the same CRM and loyalty infrastructure, so that a consumer who first encounters the brand at a festival and later visits the distillery is recognized as the same individual across both touchpoints.
Conclusion: Turning Experiences into Measurable Revenue
Last-click and single-touch models hide the real revenue from experiential marketing because they cannot see the live event, the coached enrollment pitch, or the six-release member relationship that follows. The eight-method decision framework, which includes direct tracking, incrementality testing, multi-touch attribution, marketing mix modeling, brand lift studies, engagement metrics, matched market testing, and LTV and loyalty attribution, addresses the full measurement problem when applied in combination.
The strategic priority for alcohol and CPG brands in 2026 is building the data infrastructure that makes all of these methods possible rather than choosing only one. That infrastructure includes first-party records from every attendee, a compliant promotional mechanic that closes the loop at retail, and a loyalty stack that converts a $100 bottle purchase into a $600 member relationship. Campari Group’s partnership with AnyRoad enabled a 3X increase in marketing opt-in rates and identified 4,500 repeat visitors as brand champions, which illustrates the kind of attribution output that justifies experiential budgets and funds the next activation calendar.
The brands that will win on attribution in the next three years will not be the ones with the most complex models. They will be the ones that capture a first-party record from every attendee, connect that record to a verified purchase, and build a loyalty program that turns the visit into recurring, measurable revenue.