


Written by: Bryan Grobstein, Vice President, Global Revenue, AnyRoad
Key Takeaways
- A festival activation performance dashboard turns a brand's festival footprint into structured, first-party data that withstands sponsor scrutiny and supports 48-hour ROI reporting.
- The five-view architecture organizes data for specific stakeholders: Activation Overview, Audience, Experience/Touchpoint, Social Amplification, and Sponsor ROI.
- Every metric needs a named method, hardware or software source, and documented accuracy range to remain defensible under sponsor review.
- Receipt-based cashback rebates connect activation engagement to verified purchase without POS integration or retailer cooperation.
- AnyRoad provides a purpose-built experiential platform that captures first-party data in the field and generates automated reports in approximately 20 minutes, See How AnyRoad Captures Festival Data.
What A Festival Activation Performance Dashboard Actually Is
A festival activation performance dashboard is the operational instrument that turns a brand's festival footprint into structured, first-party data. It organizes data by stakeholder, updates in real time where infrastructure allows, and stays defensible under sponsor scrutiny. A single view serves no one well because the field marketing manager, brand manager, operations lead, social team, and CMO each need a different cut of the same event.
The five-view architecture below solves this by organizing each view around a named stakeholder. Each view pulls from the same underlying event data but presents it differently, so no one has to interpret a report built for someone else:
- Activation Overview, serves the field marketing manager, covering footfall, capture rate, total engagements, and sampling velocity.
- Audience, serves the brand manager, covering demographics, opt-in rate, and first-party records captured.
- Experience/Touchpoint, serves the operations lead, covering dwell time by zone, interaction count, queue times, and staff performance.
- Social Amplification, serves the social and PR team, covering UGC volume, hashtag reach, and earned impressions.
- Sponsor ROI, serves the sponsor and CMO, covering cost per lead, cost per engagement, estimated ROI, and purchase conversion.
Explore How AnyRoad Builds These Views
Industry Landscape And Why Measurement Often Fails
Before building the dashboard, it helps to understand why most festival measurement fails. The methods available each add a failure mode that the dashboard must account for.
Festival activation measurement began with depletion reports and staffed clicker counts. A brand ambassador tallied samples distributed, a field manager reconciled inventory at load-out, and a spreadsheet arrived days later with a headcount and a sample number. That was the report.
The field has since moved toward passive sensing, RFID and NFC wristband taps, QR-code registration flows, and receipt-based redemption mechanics. Each method adds precision but also adds a failure mode. Passive Wi-Fi sensing requires devices to broadcast probe requests, a behavior that modern smartphones increasingly suppress through MAC address randomization. This reduces accuracy and makes the method unreliable as a standalone solution. RFID wristbands require venue cooperation and pre-event infrastructure. QR codes require connectivity at the point of scan.
The result is a citation pool that is shallow and generic. Most published guidance on festival activation metrics stops at “track these KPIs” without explaining how to capture the data in an environment with no reliable power, no venue Wi-Fi, and no POS integration. A Power BI template with no brand-activation layer cannot capture a first-party record in the field. A spreadsheet stitched together after the event cannot close the loop from activation to purchase. The build guide below addresses both gaps.
See How AnyRoad Closes The Measurement Gap
What Metrics Go On A Festival Activation Performance Dashboard
Every metric on a festival activation performance dashboard requires a named method, a named hardware or software source, and an honest limitation. The table below is the reference for practitioners building or evaluating a dashboard.
| Metric | Method | Hardware/Software | Honest Limitation |
|---|---|---|---|
| Footfall / passing traffic | Passive Wi-Fi or Bluetooth sensing, camera-based counting, or staffed clickers | Meshlium, Cisco Meraki, or manual counter | Wi-Fi/Bluetooth accuracy is 60–80% and overcounts devices outside the intended zone, camera counting raises privacy and consent issues, and no venue Wi-Fi means passive sensing fails |
| Capture rate | Engaged visitors divided by passing traffic | Calculated from footfall and engagement counts | Meaningless without a defensible footfall denominator |
| Dwell time | RFID/NFC wristband taps, zone-entry scans, or staffed observation | RFID wristbands, NFC readers, or staffed clickers | Dwell time can be measured through several methods beyond RFID, including BLE beacons, Wi-Fi analytics, camera-based systems, and manual check-in, though each has different precision and limitations. RFID confirms presence in a room, not active engagement within it |
| Interaction count | QR scans, NFC taps, or staffed clickers | QR code platform, NFC readers, or manual counter | Duplicate scans and shared devices inflate the number |
| Sampling velocity | Staffed clickers or inventory reconciliation | Manual counter or inventory log | Requires a staffed counter and a clean starting inventory |
| Lead capture | QR code registration, tablet-based forms, or the AnyRoad Live mobile app | AnyRoad Live mobile app, tablets, or QR codes | Offline sync failures and partial records |
| Cost per lead | Total activation cost divided by qualified leads | Calculated from activation cost and lead count | Qualified lead definition must be set before the event |
| UGC volume | Hashtag tracking, social listening tools | Sprout Social, Brandwatch, or Meltwater | Attribution to the activation versus the festival overall |
| Estimated ROI | (Return minus investment) divided by investment | Calculated from purchase conversion and activation cost | Return is only defensible if purchase conversion is measured, not assumed |
The Denominator Problem
Capture rate and engagement rate are ratios, and a ratio is only as defensible as its denominator. When the footfall number is a guess, every rate calculated from it is also a guess. Sponsors understand this, and the ones who push back on activation reports almost always push back on the denominator first.
Setting a defensible footfall number requires three decisions made before the event. Teams must define the activation footprint, the time window, and the counting method with a documented accuracy range.
The accuracy ranges differ significantly by method. Wi-Fi and Bluetooth sensing achieves 60–80% accuracy and overcounts devices outside the intended zone. Infrared beam counters typically achieve around 85–93% accuracy according to PeopleCountings.com, though other sources report lower ranges. They are prone to errors with groups and children, which makes them unsuitable for high-density outdoor festival environments. Thermal imaging achieves 95–98% accuracy and works well outdoors, though performance degrades when ambient temperature approaches body temperature. AI video-based systems achieve 95–99% accuracy in well-configured environments but raise privacy and consent considerations that teams must resolve before deployment. Manual clicker counts diverge from automated counts by 10–20%, and that error compounds during peak periods when accuracy matters most.
Capture rate is defined as store entries divided by total passerby footfall, multiplied by 100. For example, 1,000 passersby with 150 entries yields a 15% capture rate. Without an outdoor counter establishing that 1,000-person denominator, the calculation is impossible. Accuracy below 95% introduces compounding errors in conversion-rate data, which makes the counting method selection an instrumentation decision rather than an afterthought.
For festival deployments specifically, battery-powered portable outdoor counters deploy quickly with no permanent installation. This makes them suitable for temporary activations. Solar plus 4G versions deliver real-time data without manual collection and without dependence on venue Wi-Fi.
With the denominator problem addressed, the next question is how to build the dashboard itself and whether to build it from scratch or buy a purpose-built platform.
Build Vs. Buy For Festival Activation Dashboards
The build-vs-buy decision for a festival activation performance dashboard is a field-reality comparison. The real question is which approach survives a festival environment with intermittent power, no venue Wi-Fi, a two-person field team, and a sponsor expecting a report in 48 hours.
A spreadsheet or Power BI build delivers post-event analysis, flexible visualization, and low licensing cost. Those are real advantages for teams that already have the data and need to present it. A spreadsheet or Power BI build cannot capture first-party records in real time, sync data offline when connectivity drops, maintain per-attendee records across a multi-day activation, or produce a defensible link from activation to purchase without a POS integration that festival accounts do not have.
AnyRoad is the purpose-built experiential platform option for teams that need field-capable data capture. Its Front Desk app handles QR code check-ins, on-site payments, and digital waiver management, while Atlas Insights provides analytics on changes in brand affinity, NPS, and purchase intent. PinPoint's AI-powered feedback analysis then turns open-text survey responses into actionable themes in real time. Together, these tools capture the first-party data in the field, and AnyRoad integrates with Power BI, Tableau, and Looker Studio so the BI tool can visualize it afterward.

The POPLIFE case study illustrates what purpose-built field capture produces. In 2023, agency POPLIFE used AnyRoad's platform at festival activations for an artisanal mezcal brand at III Points in Florida and Portola in California. POPLIFE captured 45–50% more consumer data than competitors, with 42% of attendees opting into future marketing communications. Detailed reports on event success were generated in approximately 20 minutes using AnyRoad's automated reporting and centralized data. That timeline makes the 48-hour sponsor snapshot achievable rather than aspirational.
Get A Walkthrough Of AnyRoad's Field Capture
Closing The Loop From Activation To Purchase Without POS Integration
The weakest link in most festival activation performance dashboards is the connection between an on-site engagement and a verified retail purchase. Depletion reports measure product that left the activation, while purchase intent surveys measure stated behavior. Neither tracks what a consumer actually bought, so neither closes the loop.
AnyRoad's receipt-based cashback rebate mechanic closes this gap without requiring POS integration. After a consumer registers via the AnyRoad Live mobile app at the activation, they receive an SMS with a cashback rebate redeemable anywhere the product is sold. They buy the bottle, photograph the receipt, and text it back. AnyRoad's AI reads the receipt, confirms the eligible SKU, and pays the rebate via Venmo or PayPal. No retailer integration is required, which means the mechanic works in any on-premise or off-premise account at scale.
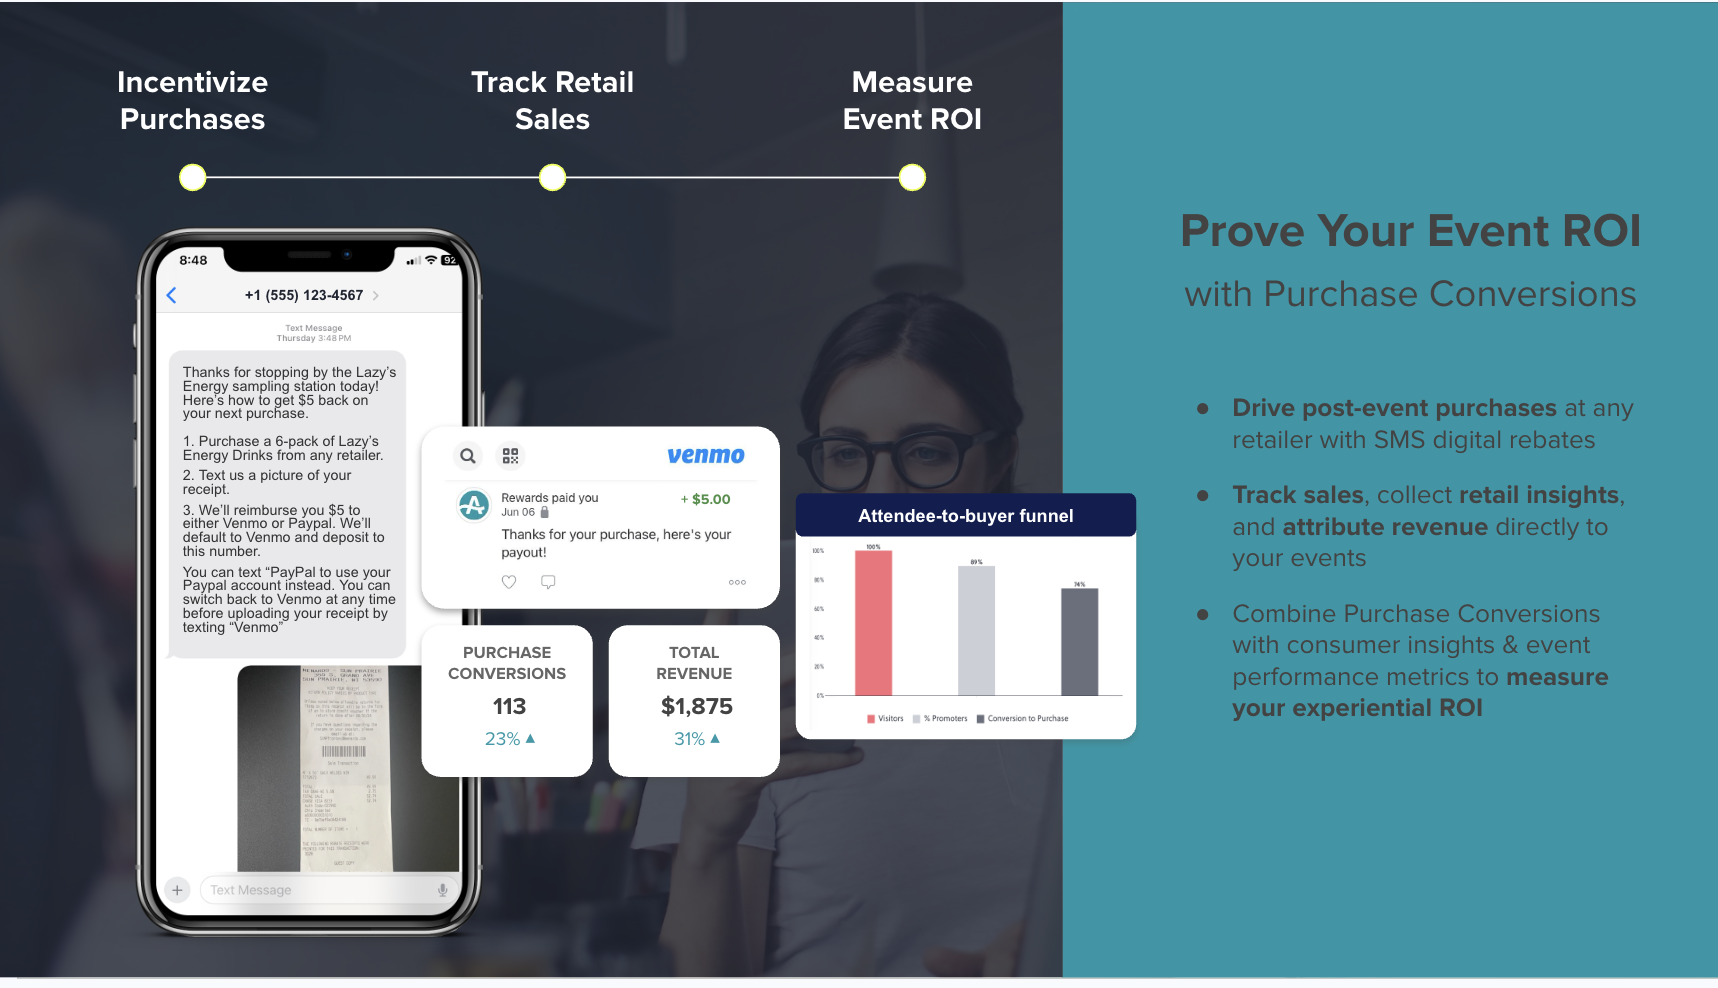
In a one-month ambassador tasting pilot with a single unnamed craft brand on a small dataset, 56% of records collected converted to a bottle purchase. This was an early pilot result on a limited sample and should not be read as a platform benchmark. The mechanic can also run as a sweepstakes, with a prize entry instead of a cashback rebate, and AnyRoad handles regulatory compliance including terms, conditions, and privacy policies.
The POPLIFE activations demonstrate what this mechanic produces at the purchase-intent level. 85% of consumers engaged at the festivals reported intent to purchase the mezcal brand's product post-event, and the festival experiences resulted in 85% post-event purchase intent among engaged consumers. Every record produced by these mechanics is a first-party record tied to a receipt-verified purchase. That data point connects experiential spend to retail sell-through and makes the Sponsor ROI view of the dashboard defensible.
Once the data is captured and the loop is closed, the final piece is delivering it to sponsors on a cadence that keeps the activation top of mind.
The Reporting Cadence For Sponsors
The 48-hour sponsor ROI report should be sent while the event is still emotionally relevant and sponsors' internal leadership conversations are active. The content of that report is deliberately narrow: footfall, total engagements, leads captured, top-performing touchpoint, and early UGC. It serves as proof of value rather than a full analysis. The renewal pitch belongs at 90 days, not in the 48-hour report.
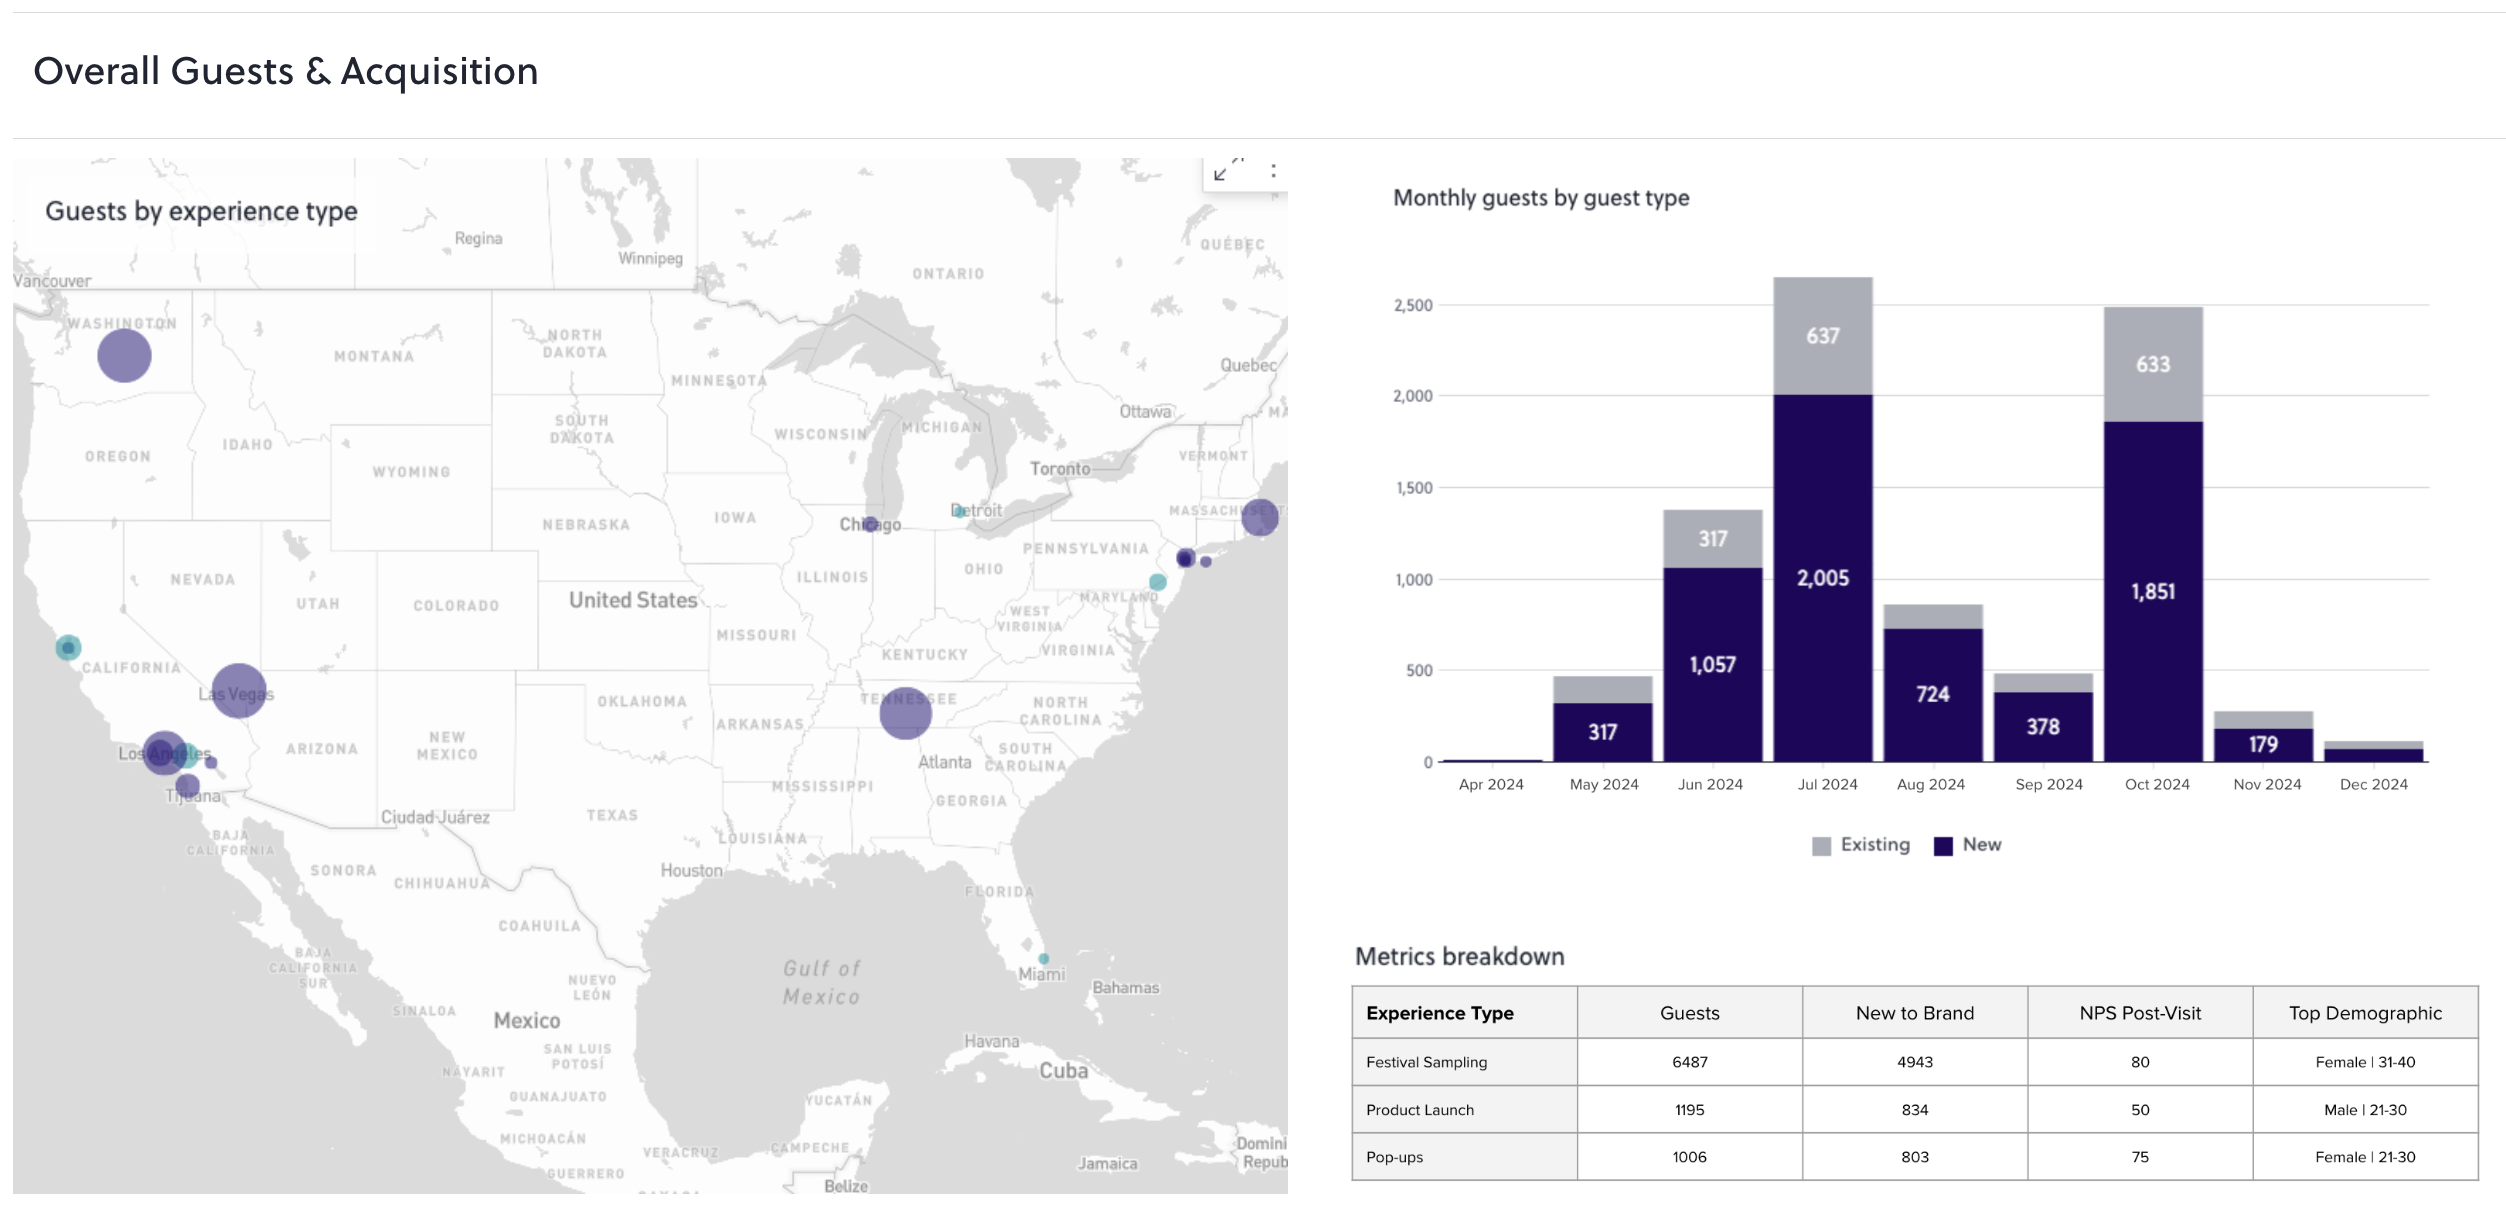
The 30-day full report is where the dashboard earns its keep. The 30-day phase captures sponsor activation ROI, partner performance, and operational learnings that inform the next planning cycle. It includes ROI calculated as (return minus investment) divided by investment, cost per lead, sentiment analysis from post-event surveys, and purchase conversion data from receipt redemptions. Pipeline and post-event conversion need time to mature, which is why the 30-day window exists.

What teams promise the sponsor before the event determines whether the report lands. Set the reporting framework, including the five views, the metrics, the counting methods, and the accuracy ranges, before load-in. A sponsor who knows the denominator methodology before the event has less room to dispute it after. A measurement plan should define 5–8 KPIs across engagement metrics, business metrics, and amplification metrics, with the collection method documented for each.
As the POPLIFE case showed, automated reporting can compress post-event data assembly to minutes, which sets the operational benchmark for meeting the 48-hour window. Manual post-event data assembly, including exporting from multiple tools, reconciling spreadsheets, and formatting a deck, routinely takes days. A purpose-built platform that centralizes data capture during the event compresses that work to minutes.
Free, DIY, And App-Based Dashboard Options
If the 48-hour reporting cadence sounds out of reach, it helps to understand what a free or DIY build can and cannot deliver. A free or DIY festival activation performance dashboard build typically combines a Google Sheets template for post-event data entry, a QR code generator for lead capture, and a social listening tool's free tier for UGC tracking. The result is a post-event analysis tool rather than a real-time dashboard. It captures nothing offline, produces no per-attendee records, and cannot close the loop from activation to purchase.
App-based capture in the field, using a mobile app like AnyRoad Live to register attendees via QR code scan at the activation, is the minimum viable instrumentation for a defensible lead capture number. It works offline, syncs when connectivity returns, and produces a first-party record for every registration. For teams evaluating a “festival activation dashboard app,” the relevant question is whether the app captures data offline and syncs it reliably, rather than whether it has a dashboard view on the device itself.

Common Pitfalls In Festival Activation Dashboards
The following mistakes appear consistently across festival activation programs and undermine dashboard credibility with sponsors:
- No perimeter definition for footfall. Without a defined activation footprint and a named counting method, the footfall number is an estimate and every rate calculated from it is indefensible.
- Relying on venue Wi-Fi that does not exist. Most festival venues do not provide reliable Wi-Fi to brand activation areas. Any data capture method that requires connectivity, including passive sensing and cloud-synced tablet forms, needs an offline fallback.
- Assuming POS integration is available. Festival accounts, on-premise bars, and third-party retailers rarely integrate their POS systems for brand activations. Purchase conversion measurement requires a method that works without this integration.
- Promising ROI without a purchase conversion method. Estimated ROI is only defensible if the return figure is measured rather than assumed. A purchase intent survey does not equal a purchase conversion number.
- Delivering the sponsor report late. Poor follow-up and lack of ROI reporting are among the most common reasons sponsors fail to renew. The 48-hour window functions as an operational requirement.
Frequently Asked Questions
Which Metrics Matter Most For Sponsor Reporting?
For sponsor reporting, focus on the metrics that tie directly to ROI. Cost per lead, purchase conversion, and estimated ROI sit at the center of sponsor scrutiny. These metrics require the same named methods and documented limitations as the full metric set, but they are the ones sponsors will question first.
How Do You Measure Foot Traffic At A Festival Activation?
Foot traffic at a festival activation can be measured through passive Wi-Fi or Bluetooth sensing, camera-based counting, infrared beam counters, thermal sensors, or staffed clickers. As noted earlier, Wi-Fi and Bluetooth sensing typically achieves 60–80% accuracy and overcounts devices outside the intended zone, a limitation that makes it unreliable as a standalone method. Infrared beam counters often perform better but struggle with groups. Thermal sensors achieve 95–98% accuracy and work well outdoors. AI video-based systems achieve 95–99% accuracy in well-configured environments but raise privacy and consent considerations. Manual clicker counts diverge from automated counts by 10–20%, with the error compounding during peak periods. Battery-powered portable outdoor counters are often the most practical option for temporary festival deployments where no permanent installation is possible.
How Do You Track Dwell Time Without RFID?
Dwell time can be measured through several methods beyond RFID, including BLE beacons, Wi-Fi analytics, camera-based systems, and manual check-in, though each has different precision and limitations. Staffed observation with time-stamped entry and exit records can produce defensible numbers for focused zones such as a product demonstration area or a sampling station, but it requires a dedicated counter and a clean starting point. Camera-based analytics using anonymized computer vision can measure average dwell time within defined zones without collecting personal data, though these systems provide aggregate behavioral data rather than individual journey mapping. QR-code zone entry and exit scans can approximate dwell time when the activation has defined entry and exit points, but duplicate scans and shared devices introduce error. The most honest approach is to document the method used and its limitations in the sponsor report rather than presenting an estimate as a measurement.
How Do You Measure Festival Activation ROI For Sponsors?
Estimated ROI is calculated as (return minus investment) divided by investment. The return figure is only defensible if purchase conversion is measured rather than assumed. Receipt-based cashback rebates and sweepstakes mechanics close the loop from activation to purchase without POS integration. The receipt-based cashback rebate described earlier closes the loop without POS integration: consumers register, buy, and submit a receipt, and AnyRoad verifies the purchase. Every redemption is a first-party record tied to a verified purchase. Cost per lead is calculated as total activation cost divided by qualified leads, with the qualified lead definition set before the event. Cost per engagement is total activation cost divided by total meaningful consumer interactions.
Is A Festival Activation Dashboard App Better Than A Spreadsheet?
A spreadsheet or Power BI build delivers post-event analysis and flexible visualization at low cost. It cannot capture first-party records in real time, sync data offline when connectivity drops, maintain per-attendee records across a multi-day activation, or produce a defensible link from activation to purchase without POS integration. A purpose-built experiential platform like AnyRoad captures first-party data in the field via the AnyRoad Live mobile app, syncs offline, and closes the loop from activation to receipt-verified purchase through its cashback rebate mechanic. AnyRoad also integrates with Power BI, Tableau, and Looker Studio, so the two approaches work together. The platform captures the data in the field, and the BI tool visualizes it afterward.
How Do You Report Festival Activation Results To A Sponsor?
The 48-hour sponsor snapshot includes footfall, total engagements, leads captured, top-performing touchpoint, and early UGC. It functions as a proof-of-value document rather than a full analysis, and the renewal pitch belongs at 90 days instead of in this report. The 30-day full report includes ROI, cost per lead, sentiment analysis from post-event surveys, and purchase conversion data from receipt redemptions. The reporting framework, including the five dashboard views, the metrics, the counting methods, and the accuracy ranges, should be agreed with the sponsor before the event so the report methodology is clear after load-out.
Conclusion
The five-view architecture, the denominator solution, and the 48-hour and 30-day reporting cadence together form an operational instrument that survives sponsor scrutiny. Every number has a named source, a documented method, and an honest limitation, and the receipt-based rebate closes the loop from activation to verified purchase.
The festival activation performance dashboard becomes the control panel for experiential programs rather than a retrospective slide deck. It guides field decisions during the event and anchors sponsor conversations afterward. The receipt-based cashback rebate mechanic produces a first-party record tied to a verified transaction. This works without POS integration or retailer cooperation, and it does not rely on purchase intent as a proxy for purchase behavior.
See How AnyRoad Tracks Activation-To-Purchase