


Written by: Bryan Grobstein, Vice President, Global Revenue, AnyRoad
Key Takeaways For Festival Teams
- Real-time analytics for festival activations should drive immediate in-event decisions and avoid becoming unused data.
- Active capture tools such as NFC, RFID, and QR codes deliver richer first-party data, while passive sensors excel at crowd flow and occupancy tracking.
- Mid-event moves like opening lanes or relocating stations should trigger from specific metrics such as occupancy spikes or collapsing dwell time.
- Receipt-verified cashback rebates connect activation engagement directly to actual bottle purchases without relying on POS integration.
- AnyRoad combines active capture, receipt-verified purchase attribution, and automated sponsor reporting in a single platform for festival activations.
Prove Which Bottles Your Activation Sold With Receipt-Verified Data. Schedule A Demo.
The Festival-Day Timeline And What Each Stage Proves
Load-In
Hardware deployment often decides whether festival-day data works. Proud Tek's RFID deployment guidance identifies five failure modes that lock in before the first attendee arrives: untested inlay position that reduces read range, wrong quantity of spares, activation bottlenecks at the gate, no offline fallback when readers lose connectivity in crowds, and unclear band removal at exit points. Load-in sets the reality of whether the capture method will survive the field. When that answer is uncertain, every later decision rests on guesswork.
Gates Open
Scan counts, registration volume, and queue length are the genuinely real-time metrics, because they fire the moment a wristband taps a reader or a QR code validates. Nevent's real-time event analytics guide gives an example: if at 9pm only 15% of ticket holders have checked in for a 10pm event, that pattern can indicate entrance queues and trigger staff to open additional access points or activate queue management. The decision in the first hour is staffing reallocation, opening a second entry lane before the queue suppresses dwell across the entire zone.
Peak
Zone occupancy, dwell time, engagement rate, and sampling throughput matter most during peak. Occupancy and throughput update in near-real-time. Dwell time and engagement rate carry a processing lag of several minutes, depending on the sensor type. Crowd Connected's 2026 people-counting comparison notes that the key question is which decisions the data supports. A doorway counter with 98% accuracy covering one entrance reveals less than an 85%-accurate system that covers every zone continuously. Peak is when teams decide whether to intervene mid-event, which the next section details.
Teardown And Same-Day
Conversion signals, sentiment capture, and sponsor-ready reporting resolve on a slower clock. By Monday morning, teams can confidently report scan counts, occupancy curves, engagement rate, and capture volume. Conversion, sentiment, and brand lift belong in the post-event report because those signals take time to resolve. Sponsors should hear this latency hierarchy before the event. Real-time metrics include occupancy, queue length, and scan counts. Near-real-time metrics include dwell time and engagement rate. Same-day and later metrics include conversion and sentiment, which appear in post-event reporting.
Turn Live Festival Metrics Into Clear ROI Stories. Schedule A Demo.
How Real-Time Data Gets Collected At Festival Activations
Two capture approaches exist, and the choice between them is the single most consequential decision a brand makes before a festival. Most tool roundups list products without explaining when each approach fits.
- Active Capture uses NFC and RFID wristbands, QR-based registration, and interactive kiosks. It demands higher participation, delivers richer first-party data, and carries a higher cost per attendee. Proud Tek warns that basic NTAG 213 or MIFARE Ultralight chips carry only a readable serial number that can be copied onto emulator cards, which makes them unsuitable for cashless or VIP access. NTAG 424 DNA or MIFARE DESFire chips authenticate cryptographically on every tap. Failure modes include tap fatigue, lost bands, and cloned credentials on under-specified chips. QR check-in reduces average entry time from 12 seconds to 3 seconds per attendee versus 45 seconds for manual name-list lookup. QR systems fail when scanners, devices, or connectivity are unavailable, so a pre-downloaded attendee list and a manual fallback protocol remain essential.
- Passive Capture uses IoT spatial sensors, heat mapping, and camera-based foot traffic tracking. It requires no participation, excels at festival foot traffic tracking, and remains weaker on identity and first-party data. SafeGraph's foot traffic provider guide notes that Wi-Fi-based tracking lacks precision because it only counts visitors who connect to the network and can produce false positives when a passerby's device auto-connects without the person entering the location. Wi-Fi tracking capture rates have degraded to 6–12% of actual visitors since Apple and Google introduced MAC address randomization. Failure modes include occlusion, weather, and density saturation.
Activation type determines the right metric set. A sampling activation inside festival gates needs throughput, capture rate, and opt-in volume, so active capture fits. A stage-side brand zone that focuses on dwell and crowd flow benefits from passive spatial sensors layered on top of active registration. A retail-adjacent tasting inside a Total Wine or an on-premise account needs receipt-verified purchase data that neither sensor type produces alone, which the purchase-connection section explains.
Mid-Event Interventions When An Activation Zone Underperforms
Each intervention should map to a specific metric trigger so teams act on clear signals instead of instinct.
- Occupancy Spikes Above Threshold → open a second entry lane immediately. A queue forming outside the activation suppresses dwell for everyone already inside, so clearing that queue restores the experience for engaged attendees.
- Dwell Time Collapses → move the prize drop or sampling station directly into the traffic path, where attendees encounter it without searching. Guests respond to visible value that sits in their path.
- A Zone Goes Dead At Hour Four → reallocate staff to the zone that still converts and change on-site messaging. Makai Inc. documents a case where a beverage brand's dashboard revealed poor engagement at outdoor music festivals and the team rerouted sampling staff to high-traffic retail locations nearby, executing the pivot in days rather than months. The same logic applies inside a multi-zone festival footprint.
- Capture Rate Drops Below Target → focus on lead-capture friction or qualification training rather than staffing volume. Makai Inc.'s field staffing guidance notes that when a field team consistently exceeds trial targets but misses qualified leads, adding more ambassadors does not solve the problem.
Even the right triggers fail when the wrong person watches the dashboard. Nevent recommends that the person monitoring the real-time dashboard on event day should not be the main promoter, who manages production. A marketing or communications lead with authority to act should own the dashboard so they can launch an email, post on social, or activate a last-minute offer immediately.
How Festival Activation Data Connects To Actual Purchases
Lead capture alone proves attendance, while receipt-verified purchases prove that bottles left shelves because of the activation.
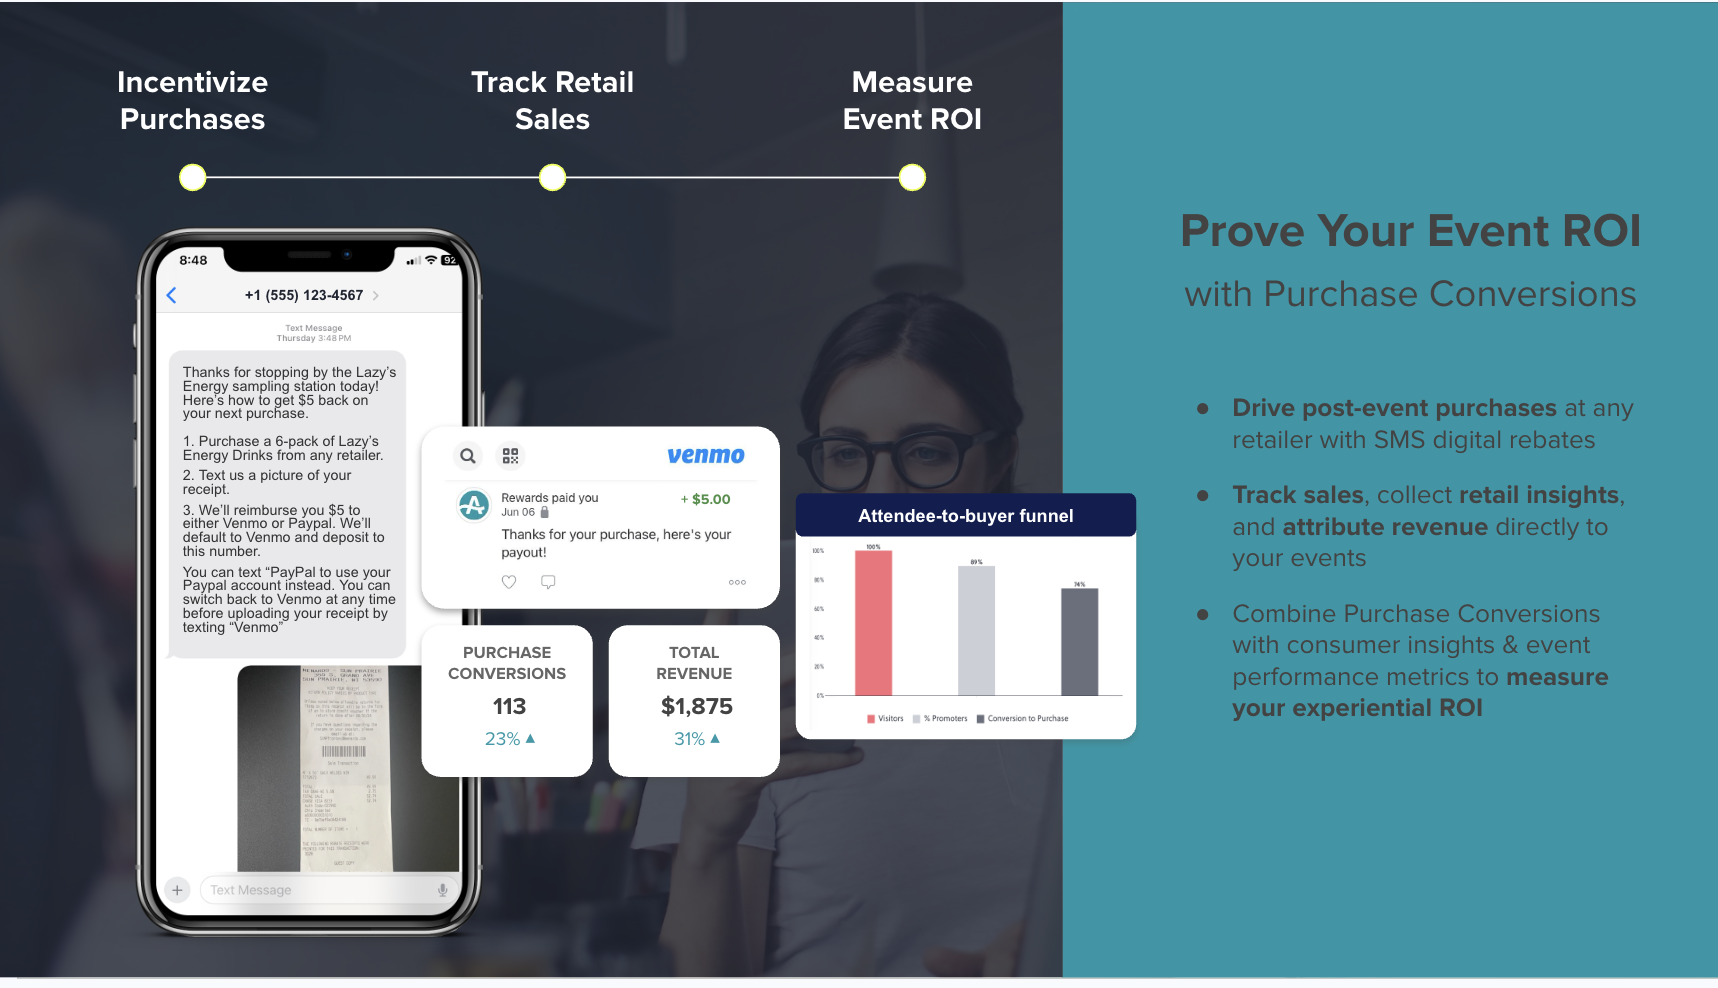
AnyRoad closes this loop through a receipt-verified cashback rebate mechanic that requires no POS integration. Guests register on the spot by scanning a QR code in the AnyRoad Live mobile app, then receive an SMS with a cashback rebate they can redeem anywhere the product is sold. After buying the bottle, they photograph the receipt and text it back. AnyRoad's AI reads the receipt, confirms the eligible SKU, and pays the rebate via Venmo or PayPal. Receipt validation works without POS access because the system operates entirely on the submitted receipt image. The brand receives a verified transaction while the retailer keeps POS systems closed, which makes the mechanic deployable across trade accounts and enables on-premise conversion tracking.

In a one-month ambassador tasting pilot with a single unnamed craft brand, 56% of the records collected converted to a bottle purchase. This early, small-sample pilot result does not represent a platform benchmark, yet it shows the directional impact that receipt-verified mechanics can produce at the activation level.
Value compounds when that verified purchase connects to recurring revenue. POPLIFE's festival activations at III Points and Portola using AnyRoad's platform captured 45–50% more consumer data than competitors, with 85% of engaged consumers reporting post-event purchase intent. Automated reporting was generated in approximately 20 minutes, which gave sponsors rapid visibility into performance.
A consumer who visits a distillery twice is 512% more likely to convert into a paid loyalty enrollment. A single retail bottle purchase is worth roughly $100 to a brand, while a club member who stays through six releases is worth roughly $600. AnyRoad's own reporting shows that experience-driven opt-ins convert to paid loyalty at four times the rate of traditional channels, with member spending increasing 150% within the first year. Churn concentrates around the six-release mark, and the underlying cause usually relates to depletion, because members who have not consumed what they already own hesitate to buy more.
Real-Time Analytics Expectations For Sponsor Reporting
Sponsors increasingly reject static PDF reports delivered two weeks after the event. Industry analysis from CrowdComms confirms that sponsors now demand immediate access to engagement metrics instead of waiting for manual organizer data. A live dashboard answers that demand when every metric clearly states its latency.
Monday-morning deliverables should include scan counts, occupancy curves, engagement rate, and capture volume, because these metrics update in real-time or near-real-time and can be reported with confidence. Post-event reports should cover conversion, sentiment, and brand lift. Presenting same-day estimates of conversion as confirmed figures risks over-promising and damaging sponsor relationships. Clear labels on each metric turn the dashboard into a credibility asset.
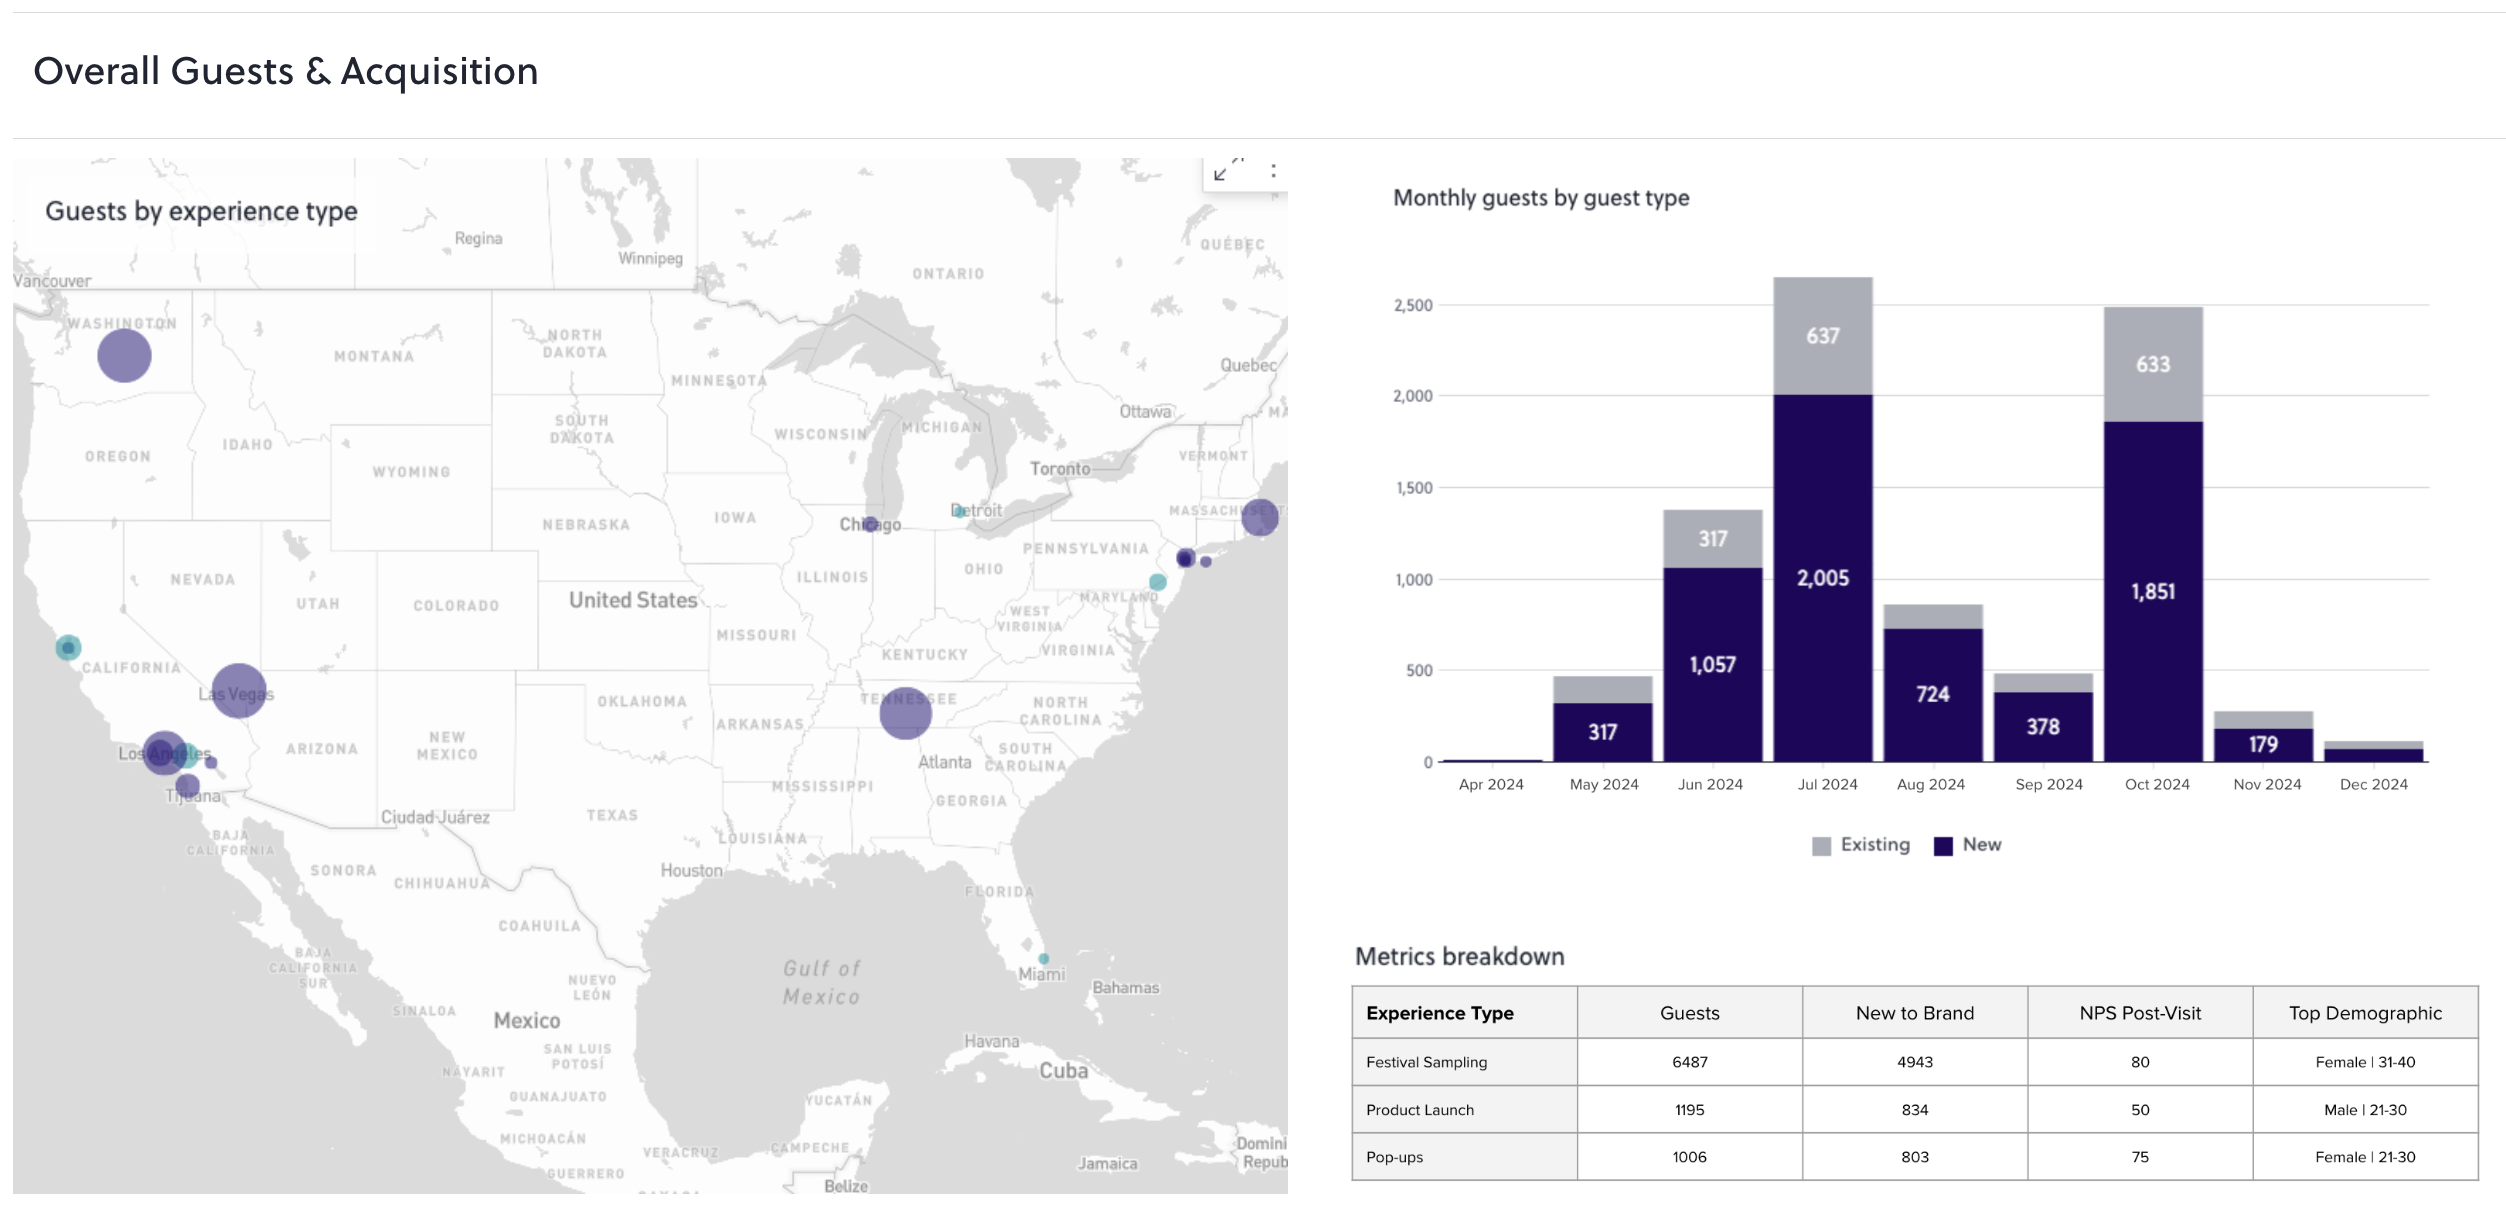
For a deeper look at dashboard structure and layout, see AnyRoad's festival activation performance dashboard guide.
What Real-Time Analytics Cannot Reveal
Sentiment, brand affinity, and Net Promoter Score require post-event collection. Hardware for a festival activation does not replace a survey mechanism. These signals almost always rely on a deliberate flow such as a post-experience micro-survey or a follow-up email loop, and they resolve over days, not minutes.
AnyRoad's PinPoint AI-powered feedback analysis turns post-event open-text survey responses into themes and sentiment drivers, identifying which parts of the experience created promoters and where improvement is needed. PinPoint complements live data rather than replacing it. The live dashboard shows what happened during the event. PinPoint explains why it happened and what to change.

Choosing A Platform For Festival Activations
Platform fit for a festival activation comes down to three questions: which capture method the activation requires, how deep the first-party data needs to be, and whether the platform connects engagement to a verified purchase. The table below maps three platform categories against those questions.
| Category | Capture Method | First-Party Data Depth | Purchase Connection |
|---|---|---|---|
| Spatial Analytics Tools (e.g., CrowdSense) | Passive, using IoT sensors, heat mapping, and camera-based foot traffic | Aggregate counts and zone flow with no identity or consent layer | No receipt validation or SKU-level attribution |
| General Event Platforms (e.g., MoZeus) | Active, using QR registration, kiosks, and engagement tracking | Participation, opt-ins, and engagement volume with limited demographic depth | Engagement metrics without receipt-verified purchase attribution |
| Experiential Platforms With End-To-End First-Party Data Capture (AnyRoad) | Active, using white-labeled QR registration via AnyRoad Live, NFC-compatible check-in, integrated ID scanning for age verification, and FullView capture from every attendee in a group | Configurable pre-, during-, and post-experience data capture, with FullView capturing every attendee and consent and compliance built in | Receipt-verified cashback rebates tied to eligible SKUs, AI receipt validation, and Venmo or PayPal payout without POS integration |
The differentiator is outcome quality, not feature count. Campari Group's partnership with AnyRoad produced a 3X increase in marketing opt-in rates and identified brand champions, along with improved operational efficiency. Those outcomes require identity-level data rather than aggregate foot traffic counts.
Connect Festival Engagement To Verified Purchases And Loyalty. Book A Demo.
Frequently Asked Questions
What Is Real-Time Analytics For A Festival Activation?
Real-time analytics for a festival activation means live capture and display of on-site engagement and movement data during an activation, used to make in-event decisions. The value sits in the decisions it enables before the gates close. Scan counts, occupancy, and queue length update in real-time. Dwell time and engagement rate update in near-real-time. Conversion and sentiment appear same-day at best and typically require post-event collection.
What Capture Methods Work Best For Festival Activations?
Two approaches dominate. Active capture uses NFC and RFID wristbands, QR-based registration, and interactive kiosks. It requires attendee participation, produces richer first-party data, and costs more per attendee, with risks such as tap fatigue, lost bands, and under-specified chips that can be cloned. Passive capture uses IoT spatial sensors, heat mapping, and camera-based foot traffic tracking. It requires no participation, works well for crowd flow and occupancy, and remains weaker on identity and first-party data, with risks such as occlusion, weather interference, and density saturation. A sampling activation needs active capture for opt-ins, while a stage-side zone benefits from passive spatial sensors layered on top of active registration.
Can A Festival Activation Be Tracked All The Way To A Bottle Purchase?
Receipt-verified cashback rebates that require no POS integration make this possible. The guest registers on-site by scanning a QR code, receives an SMS with a cashback rebate redeemable anywhere the product is sold, buys the bottle, and texts back a photo of the receipt. AI validates the receipt against the eligible SKU and pays the rebate via Venmo or PayPal. Every verified purchase produces a first-party record tied to a receipt-confirmed transaction, which connects experiential spend to retail sell-through and replaces the depletion report as the measure of whether an activation worked.
Which Insights Fall Outside Real-Time Analytics?
Sentiment, brand affinity, and Net Promoter Score fall outside real-time analytics. These signals require post-event survey collection and resolve over days, not minutes. A live dashboard reports what happened during the event, such as occupancy, throughput, and scan volume. Post-event AI-powered feedback analysis, such as AnyRoad's PinPoint, explains why it happened and what to change. The two work together, while hardware alone cannot solve a survey problem.
Conclusion: Turning Festival Data Into Revenue Proof
Real-time analytics earns its hardware cost when it changes an in-event decision. A zone that underperforms at hour four remains recoverable when the dashboard fires the right signal to someone with authority to act. Value increases further when that live signal connects to a receipt-verified purchase, because that connection answers the sponsor's core question by Monday morning about which bottles the activation actually sold.
The POPLIFE activations at III Points and Portola, cited earlier, show what that architecture produces at scale. The cashback rebate pilot with a single craft brand demonstrated strong conversion from collected records to verified bottle purchases. These early results do not guarantee future performance, yet they point clearly toward a new standard. Brands that build capture infrastructure before the gates open move beyond depletion reports and into verified revenue impact.
See How Real-Time Festival Analytics Tie Directly To Sell-Through. Schedule A Demo.