


Written by: Bryan Grobstein, Vice President, Global Revenue, AnyRoad
Key Takeaways
- Festival activation tracking metrics span three layers: on-site engagement, digital interaction, and post-event outcomes that together prove ROI.
- Standard event metrics struggle at festivals because of chaotic environments, short attention windows, and intense competition for attendee time.
- Organizing metrics into on-site, digital, and post-event buckets tied to specific business goals creates a defensible reporting structure for leadership.
- Unified first-party data platforms that connect registration, feedback, and purchase attribution provide the foundation for credible festival ROI measurement.
- A unified first-party data platform connects on-site, digital, and post-event metrics into a single, defensible ROI story for stakeholders.
The Problem: Why Festivals Break Your Standard Event Metrics
Festival attendees spend 8 to 12 hours per day on-site, which sounds like an enormous engagement window. The environment tells a different story. Dozens of competing activations, live music stages pulling foot traffic in unpredictable waves, weather exposure, and limited power and Wi-Fi infrastructure all compete for attention. The audience also will not queue patiently for something that does not immediately excite them. Your activation has only seconds to capture attention before the crowd moves on.
Generic event metrics such as total attendance, impressions, and samples distributed were designed for controlled environments like brand homes, corporate conferences, and owned retail events. They do not account for the chaotic throughput dynamics of a 100,000-person festival. A festival activation that distributes 10,000 samples to consumers who discard them after one sip underperforms an activation that creates 2,000 deep brand experiences generating social content, email captures, and post-festival purchases.
Measurement must begin in the brief, not the recap deck. Festival activations designed without data capture in mind produce only depletion reports and headcounts. Those numbers rarely survive a budget review.
The Three Buckets Of Festival Metrics
A complete festival measurement framework organizes metrics into three categories that together tell the full story of activation impact.
On-Site Metrics: Measuring Immediate Engagement
On-site metrics capture what happened during the activation itself. The core measures are:
- Footfall and participation rate – total visitors who entered or interacted with the activation, expressed as a percentage of overall festival attendance
- Dwell time – average time spent at the activation; longer dwell often correlates with deeper brand engagement and higher data capture rates
- Engagement rate – interactions, product trials, and samples distributed relative to total footfall
- Lead capture rate – consented email addresses, phone numbers, or app registrations as a percentage of total interactions; industry ranges run from 5% to 15% depending on incentive and capture method
- On-site sentiment – quick survey responses collected at the point of interaction
Tracking tools for on-site metrics include QR codes, mobile registration apps, staff tablets, and passive Bluetooth wearable tracking for dwell time. The critical discipline is capturing first-party data from every attendee, not just the person who initiated contact. Without a systematic approach, brands routinely miss contact information for the majority of their guests. Proximo Spirits, for example, discovered they were missing data for over 66% of their guests before implementing AnyRoad's FullView feature. After rollout, they collected 69% more guest data and 34% more NPS responses.

Digital Metrics: Tracking The Ripple Effect
Digital metrics measure how the activation extends beyond the physical footprint. Key measures include:
- Branded hashtag usage and user-generated content volume – 96% of millennials who engage with a brand at a live event photograph or video the experience and share it online
- Social media impressions and earned media value
- QR code scans tied to specific activation touchpoints
- UTM-tagged web traffic from festival-specific landing pages
- Online contest or sweepstakes entries
Teams should instrument each digital touchpoint before the event. Tagging every QR code and landing page before the activation, and geofencing the venue for post-visit retail attribution, are prerequisites for defensible digital measurement. Connecting a QR scan to a sweepstakes entry, for example, creates a traceable record linking on-site behavior to a digital outcome.
Post-Event Metrics: Proving The Business Impact
Post-event metrics determine whether festival activations justify their budgets. The measures that matter most to leadership are:
- Purchase intent and conversion rate – 61% of consumers are more inclined to purchase a product after attending a live marketing event
- Retail sales velocity lift in the festival's geographic market, measured over 2–4 weeks post-event
- Email opt-in conversion rate – the percentage of captured leads who open, click, and convert through follow-up sequences
- Promo code and cashback rebate redemption rate
- Net Promoter Score (NPS) and brand affinity delta versus pre-event baseline
- New customer acquisition rate
Tracking these metrics requires CRM integration, promo code infrastructure, and follow-up survey deployment within 48 hours of the event while recall remains high. The POPLIFE mezcal brand activation at III Points and Portola festivals illustrates what is achievable. Eighty-five percent of engaged consumers reported post-event purchase intent, 34% of registrants were new to the brand, and the activation delivered a 75% lift in purchase intent post-experience, all measured through AnyRoad's platform.
Once you understand these three buckets of metrics, the next step is choosing which ones to prioritize for each activation.
How To Choose The Right Metrics: A Decision Framework
The most common measurement mistake is tracking everything and prioritizing nothing. The right starting point is the activation's primary business goal. Once that goal is clear, the relevant metrics follow.
| Activation Goal | Primary Metrics | Secondary Metrics |
|---|---|---|
| Brand awareness and recall | Participation rate, social impressions, UGC volume | Dwell time, brand lift survey delta |
| Lead generation and data capture | Lead capture rate, marketing opt-in rate, cost per lead | Email open rate, 30-day conversion rate |
| Product trial and purchase conversion | Samples distributed, trial acceptance rate, promo code redemption | Retail velocity lift, 90-day repeat purchase rate |
| Loyalty and retention | NPS, brand affinity delta, repeat attendee rate | Club or membership enrollment rate, customer lifetime value |
Activation format also shapes metric selection. A sampling station focuses on trial acceptance rate and lead capture. A VIP lounge focuses on dwell time and NPS. An interactive tech installation focuses on participation rate and UGC volume. For data capture specifically, mechanic-driven formats like Spin to Win deliver a better cost per lead than awareness-first formats like a 360 photo booth.
Tools And Technologies For Tracking Festival Success
The technology stack for festival measurement spans several categories: registration and check-in platforms, QR code generators with real-time analytics, spatial and dwell-time tracking, social listening tools, and CRM or CDP platforms for post-event activation. These tools often operate in silos, which makes unified reporting difficult.
Marketers using integrated data see 67% better ROI tracking accuracy compared to those with disconnected tools. A unified platform that captures first-party data across registration, on-site interaction, feedback, and post-event conversion creates a reliable foundation for festival ROI reporting.

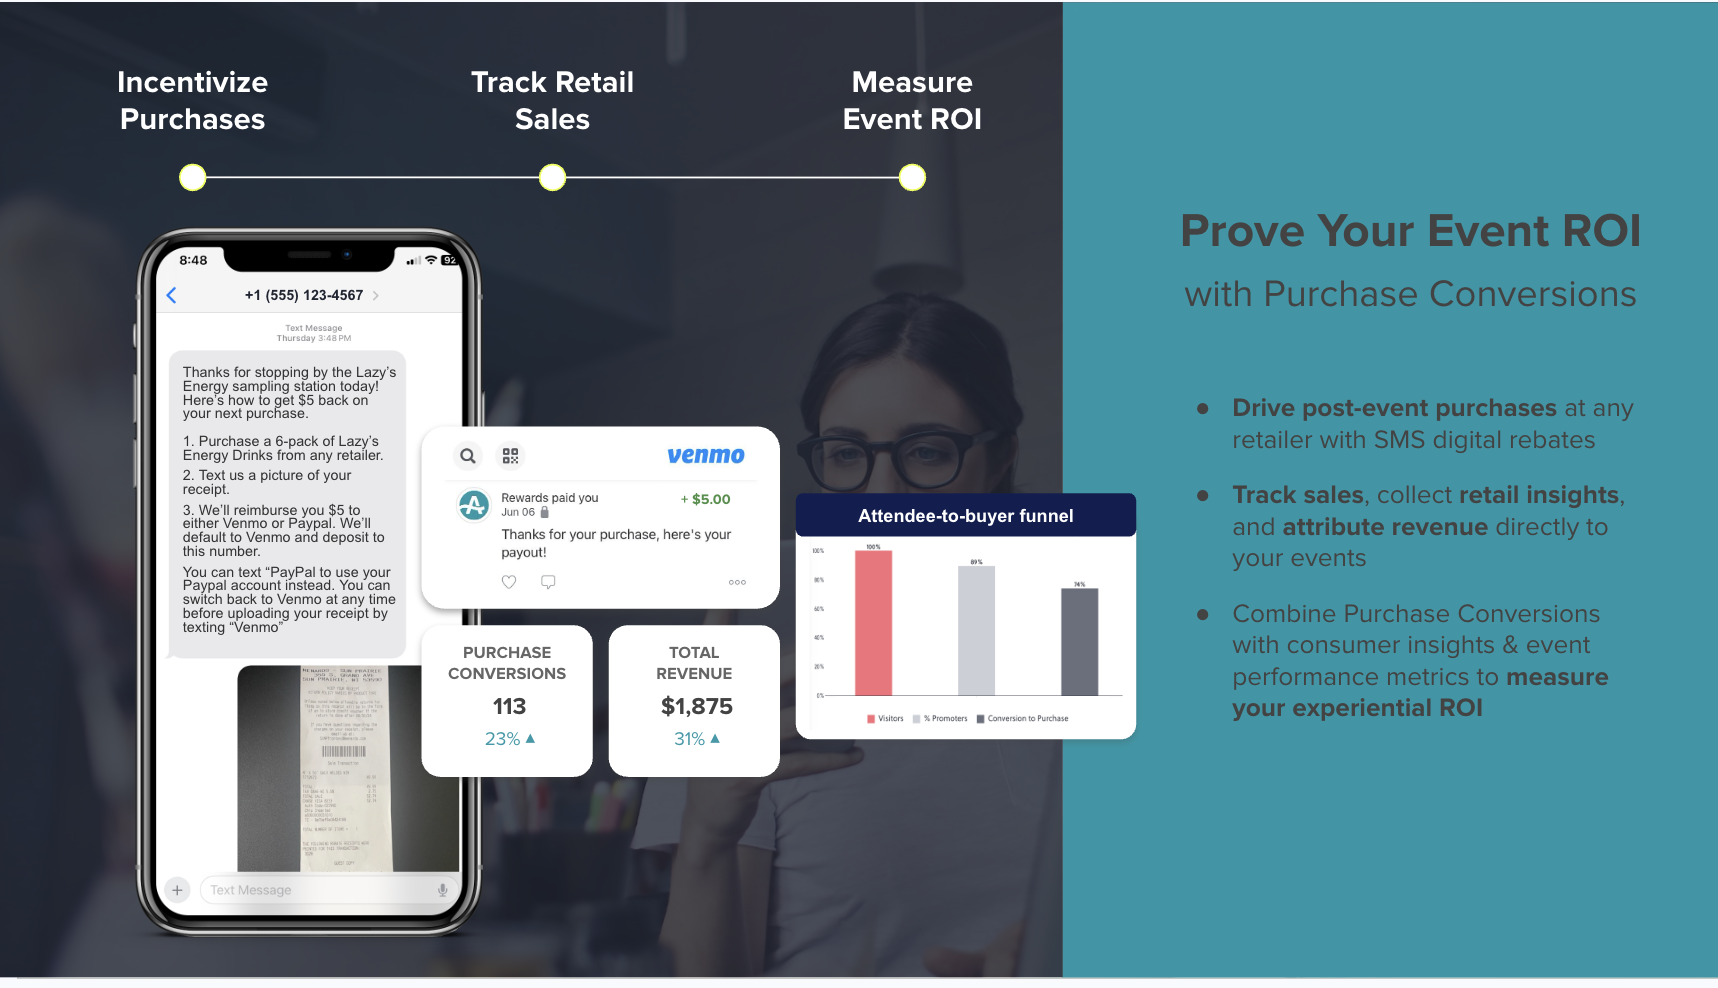
AnyRoad is built for this unified approach. Its Front Desk app handles on-site check-in and data capture at scale, while the FullView feature ensures you capture contact information and consent from every attendee in a group, not just the booking lead. For festival activations, AnyRoad Live turns ambassador tastings and festival experiences into structured data capture points, using QR-triggered registration and SMS-delivered cashback rebates to connect an on-site interaction to a verified retail purchase. Once feedback is collected, PinPoint, AnyRoad's AI-powered analysis tool, processes open-text survey responses at scale to surface themes and sentiment drivers in real time. Finally, the analytics dashboard connects on-site engagement, NPS, purchase intent, and post-event conversion into a single reporting view.

See how AnyRoad supports ROI tracking for brand activations.
Realistic Benchmarks For Festival Activations
Benchmarks for festival activations vary by industry, activation format, incentive structure, and festival tier. The following ranges provide directional starting points that you can refine against your own historical data. The most useful benchmarks focus on lead capture, marketing opt-in, and post-event purchase intent because they connect directly to revenue.
- Lead capture rate: 5%–15% of total interactions, rising with stronger incentives and frictionless capture mechanics
- Marketing opt-in rate: 42% of attendees opted into future marketing communications in the POPLIFE mezcal festival activation using AnyRoad, as reported in a case study on CaseStudies.com.
- Trial acceptance rate (inside-gate sampling): 50%–70%
- Post-event purchase intent: 85% among engaged consumers in a well-executed festival activation using AnyRoad's platform
- New-to-brand rate among registrants: 34% in the POPLIFE mezcal activation
- 90-day activation ROI (comprehensive measurement): 3x–8x when measured across a full 90-day attribution window
- Retail velocity lift in festival market (4 weeks post-event): Air Fresh Marketing's craft hard seltzer festival case study recorded a 340% retail velocity lift, which represents an upper-bound illustration from a well-executed multi-festival campaign
How To Turn Data Into Insights: Reporting To Stakeholders
A post-event report that leads with sample counts and social impressions rarely survives a budget review. A structure that works with finance and leadership follows this sequence:
- Executive summary – one paragraph connecting the activation to its stated business goal and the headline result
- Key metrics by bucket – on-site, digital, and post-event metrics presented in their respective categories with actuals versus targets
- Comparison to goals and benchmarks – performance against predefined KPIs and directional industry benchmarks
- Insights – what the data reveals about audience behavior, product reception, and activation design
- Recommendations – specific changes to format, staffing, incentive structure, or follow-up cadence for the next activation
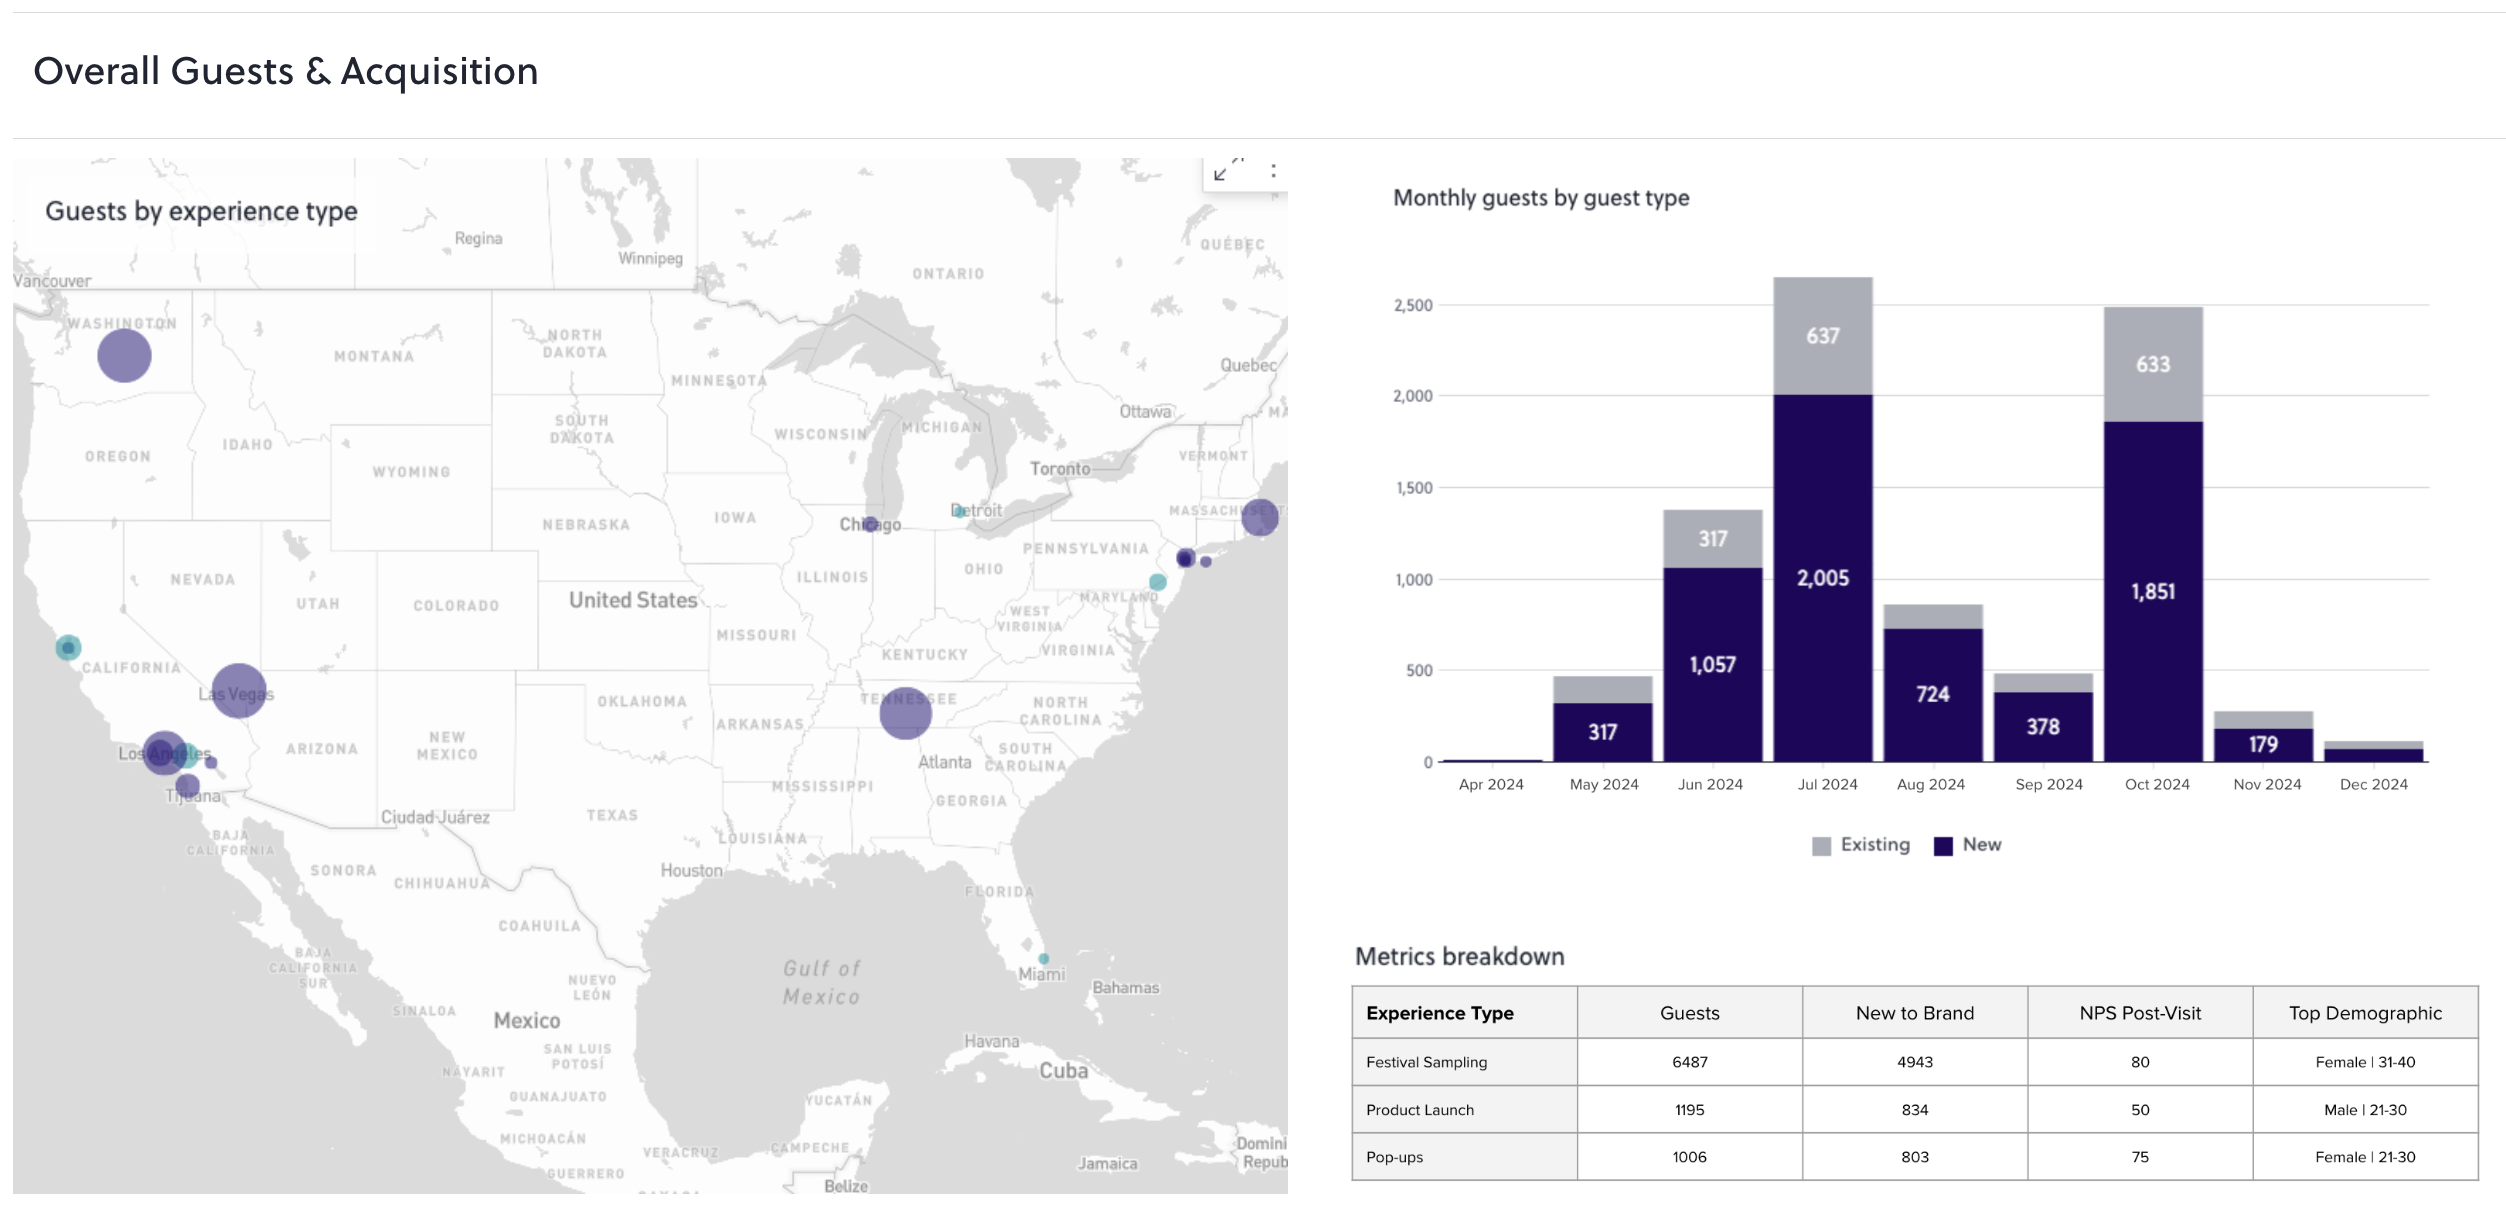
Hard ROI (directly traceable revenue) and soft ROI (brand lift, sentiment, UGC) must be kept in separate columns in every report presented to finance. Mixing them, even once, resets trust to zero. AnyRoad's analytics dashboard generates this reporting structure automatically, reducing post-event reporting time from days to minutes. Leiper's Fork Distillery, for example, reduced management reporting time from a day and a half to 90 minutes after implementing AnyRoad.
Common Pitfalls And How To Avoid Them
- Tracking vanity metrics only. Footfall and impressions provide context but do not prove business impact. Define a primary conversion metric such as purchase, opt-in, or demo request before the activation launches.
- Capturing data from only the booking lead. In group activations, the person who registered is rarely the only valuable contact. Tools like AnyRoad's FullView feature address this by capturing data from every attendee in a group.
- Failing to instrument digital touchpoints before the event. UTM parameters, unique QR codes, and dedicated landing pages must be set up in advance. Retroactive attribution often produces unreliable results.
- Using disconnected tools that create data silos. Fifty-eight percent of B2B SMEs cannot trace a lead from first touch to customer because their CRM is not connected to their marketing tools. A unified platform closes this gap.
- Setting the attribution window too short. Festival ROI measurement should span immediate (within 48 hours), 30-day, and 90-day horizons to capture the full downstream impact of trial and data capture.
- Designing measurement as an afterthought. Teams that design activations with measurement built in from the start consistently outperform teams that try to reconstruct data after the fact.
Practical Examples Of Festival Measurement In Action
These examples show how different activation formats apply the measurement framework in practice. One focuses on direct retail attribution, another on agency-led data capture at scale, and a third on a low-friction UGC-driven model.
CPG Beverage Brand At A Multi-Day Music Festival
A beverage brand running a sampling activation at a 75,000-attendee festival used QR-triggered registration to capture opt-ins at the point of trial. Registrants received an SMS with a cashback rebate redeemable at any retailer carrying the product. Receipt verification confirmed purchase and connected the on-site interaction to a retail sale without requiring POS integration. A 30-day follow-up email sequence to captured leads then drove measurable e-commerce conversion tracked via UTM parameters.
Spirits Brand Using Agency Partnership For Festival Data Capture
Agency POPLIFE activated an artisanal mezcal brand at III Points in Florida and Portola in California, using AnyRoad's platform to reward attendees with branded swag in exchange for registration. The approach enabled offline data collection and automated post-event survey deployment. The result was 45–50% more consumer data captured than competitors, with detailed event reports generated in approximately 20 minutes.
Interactive Tech Activation Optimizing For UGC And Dwell Time
A brand deploying an AI photo booth at a regional festival designed the sharing journey to require email or SMS delivery of the content. This created a natural, low-friction data capture moment. Every share extended the activation's reach organically. Post-event, the captured contacts entered a segmented email flow based on the content they received, which enabled personalized follow-up tied to the specific experience.
Frequently Asked Questions (FAQ)
What Are The Most Important Metrics For A Festival Activation?
The most important metrics depend on the activation's primary goal. Metrics that consistently prove business impact include lead capture rate, post-event purchase intent, marketing opt-in rate, retail sales velocity lift in the festival's geographic market, and NPS or brand affinity delta versus a pre-event baseline. Vanity metrics like total footfall and social impressions provide context but should not anchor the ROI conversation. A framework that organizes metrics into on-site, digital, and post-event buckets, and ties each bucket to a specific business outcome, gives stakeholders a clear structure.
How Do You Measure ROI From A Festival Activation?
Festival activation ROI is calculated by comparing total investment against total attributable return across a defined attribution window. Total investment includes sponsorship fees, activation build costs, staffing, product, travel, and logistics. Total return includes direct on-site revenue, promo code and rebate redemptions, email flow conversions tracked via UTM parameters, and estimated earned media value. Hard ROI (directly traceable revenue) and soft ROI (brand lift, sentiment, UGC reach) should appear in separate columns to maintain credibility with finance. Teams should set the attribution window before the event, typically 90 days, to capture the full downstream impact of trial and data capture. Well-executed festival activations measured comprehensively over a 90-day window have delivered 3x to 8x returns, with results varying by industry, activation format, and measurement rigor.
What Tools Can Help Track Festival Activation Metrics?
The core technology categories for festival measurement are registration and check-in platforms for on-site data capture and consent management, QR code generators with real-time scan analytics for linking on-site actions to digital outcomes, social listening tools for tracking hashtag usage and UGC volume, CRM or CDP platforms for post-event lead activation and conversion tracking, and survey tools for NPS and purchase intent measurement. These tools often do not integrate natively, which creates data silos and complicates reporting. AnyRoad addresses this by providing a single platform that covers on-site registration, feedback collection, AI-powered analytics, and post-event purchase conversion tracking, with native integrations to CRM platforms including HubSpot, Salesforce, and Klaviyo.
How Do You Capture Data From Attendees At A Busy Festival?
Effective data capture at festivals relies on three design principles: immediate value exchange, minimal friction, and consent built into the experience rather than appended at the end. The most effective mechanics tie data capture to something the attendee wants, such as branded content delivered via SMS or email, a sweepstakes entry, a cashback rebate, or access to a utility like phone charging. QR codes on attendees' own phones reduce queue bottlenecks. Staff tablets and mobile apps enable offline capture when connectivity is unreliable. The critical discipline is capturing data from every attendee in a group, not just the person who initiated contact, which AnyRoad's FullView feature is designed to support. All capture mechanics must include explicit consent for the specific downstream uses intended, including marketing communications and data sharing.
What Is A Good Lead Capture Rate For A Festival?
As noted earlier, lead capture rates typically fall between 5% and 15% of interactions, with higher performance when incentives are compelling and capture mechanics are frictionless. Activations using strong value exchanges such as cashback rebates, exclusive content, or prize entries and mobile-first capture tools consistently outperform those relying on passive sign-up forms or staff-led data entry. The POPLIFE mezcal brand activation using AnyRoad achieved a 42% marketing opt-in rate among registrants, which shows what is possible with the right combination of incentive design and capture infrastructure. Tracking capture rate improvement across your own events provides a stronger signal of program maturity than any single external benchmark.
Conclusion
Festival activations represent some of the highest-stakes, highest-potential investments in experiential marketing. The U.S. festival industry generates over $3.4 billion annually, and 74% of festival attendees report being more likely to purchase a product they first tried at a music festival. Brands that measure these programs rigorously capture the full value of that opportunity.
Generic event metrics struggle in the festival environment because they were not designed for it. A tailored measurement framework organized into on-site, digital, and post-event buckets, anchored to a specific business goal, and reported across a 90-day attribution window turns festival spend into a defensible ROI story.
AnyRoad provides a unified platform to capture first-party data at every touchpoint, analyze feedback with AI, and connect on-site engagement to post-event revenue. The Front Desk app and FullView feature capture data from every attendee, PinPoint provides real-time sentiment analysis, and cashback rebate mechanics link an activation to a verified retail purchase. AnyRoad is built for the measurement demands that festivals create.
Ready to prove the ROI of your festival activations? Get a tailored AnyRoad demo for your brand.