


Key Takeaways
- Gen Z prioritizes authentic, values-aligned experiences, with 73% preferring in-person activations. Metrics like Authenticity Score and Values Alignment Rate prove emotional resonance.
- Social virality drives ROI through Social Shares & EMV, Influencer MIV, and rapid Response Time to Mentions, generating 3x more user content than traditional ads.
- Behavioral metrics such as Dwell Time, Engagement Depth, and Gen Z NPS Experiential measure true participation beyond attendance numbers.
- Long-term success depends on Purchase Intent Conversion, CLTV Lift, and Retention Rate Post-Experience, which connect events to sustained revenue growth.
- AnyRoad’s AI tools, like PinPoint and FullView, capture these 12 essential metrics. See how these tools work in your context to transform your Gen Z experiences into proven ROI.
Digital & Social Metrics for Gen Z Virality
Gen Z lives where physical experiences and digital conversations meet, so success depends on how in-person moments spread online. The following metrics show how your experiences turn into social amplification and viral reach.
Social Shares & Earned Media Value (EMV)
Gen Z consumers generate 3x more authentic content when brands create shareable moments, so social amplification becomes a core success signal. Calculate EMV using the formula: EMV = social shares × average post value. 90% of Gen Z consumers say social media significantly impacts their purchasing choices, which means content created at your events influences peer buying decisions. To capture this user-generated content consistently, AnyRoad integrates with photobooth operators like Smilebooth at experiential events.
Influencer Media Impact Value (MIV)
Track the monetary value of influencer mentions and collaborations during experiential events, with a focus on micro-influencer partnerships. This focus matters because 69% of Gen Z are more likely to engage with recommendations from micro-influencers than traditional celebrities, so their endorsements carry outsized weight.
Calculate MIV by multiplying influencer reach by engagement rate and average cost per impression, which captures both scale and interaction quality. To run this attribution analysis across different audience segments, AnyRoad’s Atlas Insights analytics dashboard provides robust data filtering by demographics and experience type.
Response Time to Social Mentions
Gen Z expects immediate brand responses on social platforms, especially during live experiences. Response times that exceed 15 minutes risk audience abandonment and negative sentiment. Track average response time across all social channels during and after experiential events to maintain trust. AnyRoad’s real-time analytics and integrations with marketing tools help teams stay responsive to consumer feedback.
Speed of response sets the baseline, yet the substance of what Gen Z says about your brand reveals deeper success. The next metrics focus on whether your experiences align with Gen Z expectations for authenticity and shared values.
Authenticity & Values Resonance Metrics
Authenticity Score
Authenticity Score shows how genuinely your experience lands with Gen Z audiences. Measure genuine sentiment using the formula: Authenticity Score = (Positive sentiment mentions / Total mentions) × 100. 61% of Gen Z consumers prefer user-generated content to traditional advertising, so authentic sentiment directly supports brand credibility. AnyRoad’s PinPoint AI analyzes thousands of open-text responses to distinguish deep emotional connections from surface-level engagement.
Values Alignment Rate
73% of Gen Z are willing to pay more for sustainable products, and values alignment drives 2.5x higher loyalty rates. Capture this metric by surveying attendees on brand values resonance before and after experiences. Track percentage increases in values alignment scores post-event to see how well your programming reflects their priorities. AnyRoad’s configurable survey capabilities and PinPoint AI analysis capture nuanced consumer feedback at scale.
Brand Trust Lift
Brand Trust Lift quantifies how much your experiences increase trust. Measure trust score improvements through pre- and post-experience surveys using a 10-point scale. Just as Gen Z pays more for aligned values, they also reward trusted brands with premium pricing, and 90% will pay more for brands they trust.
Calculate Brand Trust Lift as: (Post-event trust score - Pre-event trust score) / Pre-event trust score × 100. Diageo achieved a 16-point NPS increase using AnyRoad’s PinPoint AI to customize flavor profiles based on trust-building feedback themes.
“Using AnyRoad data enables us to make smarter decisions on programming, better understand brand loyalty, and influence purchase behavior,” notes Glenn Cox, Head of Brewery Experiences Marketing at Anheuser-Busch. This data-driven approach depends on tracking not only what attendees feel, but also what they actually do during experiences.
Experience & Behavioral Metrics
Dwell Time & Conversion Rate
Dwell Time and Conversion Rate show how deeply Gen Z engages with your activations. Track average time spent at experiential activations and correlate that data with purchase intent. 61% of Gen Z prefer discovering new products in physical stores, so dwell time becomes a critical engagement indicator. Calculate performance using average dwell time alongside purchase intent conversion. AnyRoad’s Front Desk app with QR code check-ins streamlines on-site operations and supports accurate timing data capture.
Engagement Depth
Engagement Depth reveals how actively attendees participate across touchpoints. Measure interactions per attendee across all experience elements. 43% of Gen Z engage with interactive media like polls, quizzes, and live streams, which shows their preference for participation over passive consumption.
Calculate Engagement Depth as: Total interactions / Total attendees. Track photo booth usage, survey completions, product sampling, and digital touchpoint engagement. AnyRoad’s FullView feature captures data from every attendee in a group, not just the booking contact, which gives a more complete picture of engagement.
Gen Z NPS Experiential
Gen Z NPS Experiential adapts traditional NPS to modern experiential contexts. Ask, “How likely are you to recommend this brand experience to friends?” on a 0-10 scale. Brand recall and sentiment measured through surveys and feedback rank as high-importance KPIs for Gen Z experiential campaigns. Absolut achieved a 36% revenue per visit lift by refining experiences based on NPS feedback captured through AnyRoad’s platform.
These behavioral metrics connect directly to loyalty and revenue outcomes. The next set of metrics extends the view beyond the event to long-term value and retention.
Loyalty & ROI Metrics Beyond Attendance
Purchase Intent & Conversion
Purchase Intent and Conversion link experiential moments to real sales. Track stated purchase intent during experiences and actual conversion within 30 to 90 days post-event, which shows whether initial enthusiasm turns into purchases. 90% of consumers who taste Just Egg’s product intend to buy it, which highlights the power of experiential sampling.
Quantify financial impact using ROI: (Revenue generated - Campaign cost) / Campaign cost × 100. Connecting intent to actual purchases requires attribution tools such as AnyRoad’s Purchase Conversion Tools, which enable SMS rebates and promotional codes that directly link experiences to retail sales.
Customer Lifetime Value (CLTV) Lift
CLTV Lift shows how experiences change the long-term value of Gen Z customers. Measure CLTV increases for attendees versus non-attendees over 12-month periods. A 5% increase in customer retention can drive profit growth of 25% to 95%, so even modest CLTV gains matter.
Calculate CLTV Lift as: (Average CLTV of experience attendees - Average CLTV of non-attendees) / Average CLTV of non-attendees × 100. AnyRoad’s integrations with CRM systems support long-term CLTV tracking that basic event platforms cannot match.
Retention Rate Post-Experience
Retention Rate Post-Experience measures how well your brand stays in Gen Z’s tight consideration set. Track repeat purchase behavior and brand engagement 6 to 12 months after experiential touchpoints. 85% of Gen Z shop regularly with five brands or fewer, so winning a spot in that group drives sustained growth. Sierra Nevada achieved an 85% brand conversion rate post-event by implementing feedback-driven improvements through AnyRoad’s analytics. Calculate retention rate as: (Customers who made repeat purchases / Total experience attendees) × 100.
Prove Gen Z brand experience metrics ROI. Get your measurement framework.
These 12 essential metrics create a practical framework for scaling Gen Z experiential marketing with measurable impact. Unlike basic ticketing platforms like Eventbrite that focus on attendance, AnyRoad’s AI-powered platform captures the nuanced data points that drive authentic Gen Z engagement and long-term loyalty. Top CPG and alcohol brands rely on AnyRoad’s comprehensive measurement capabilities to justify experiential budgets and improve campaign performance.
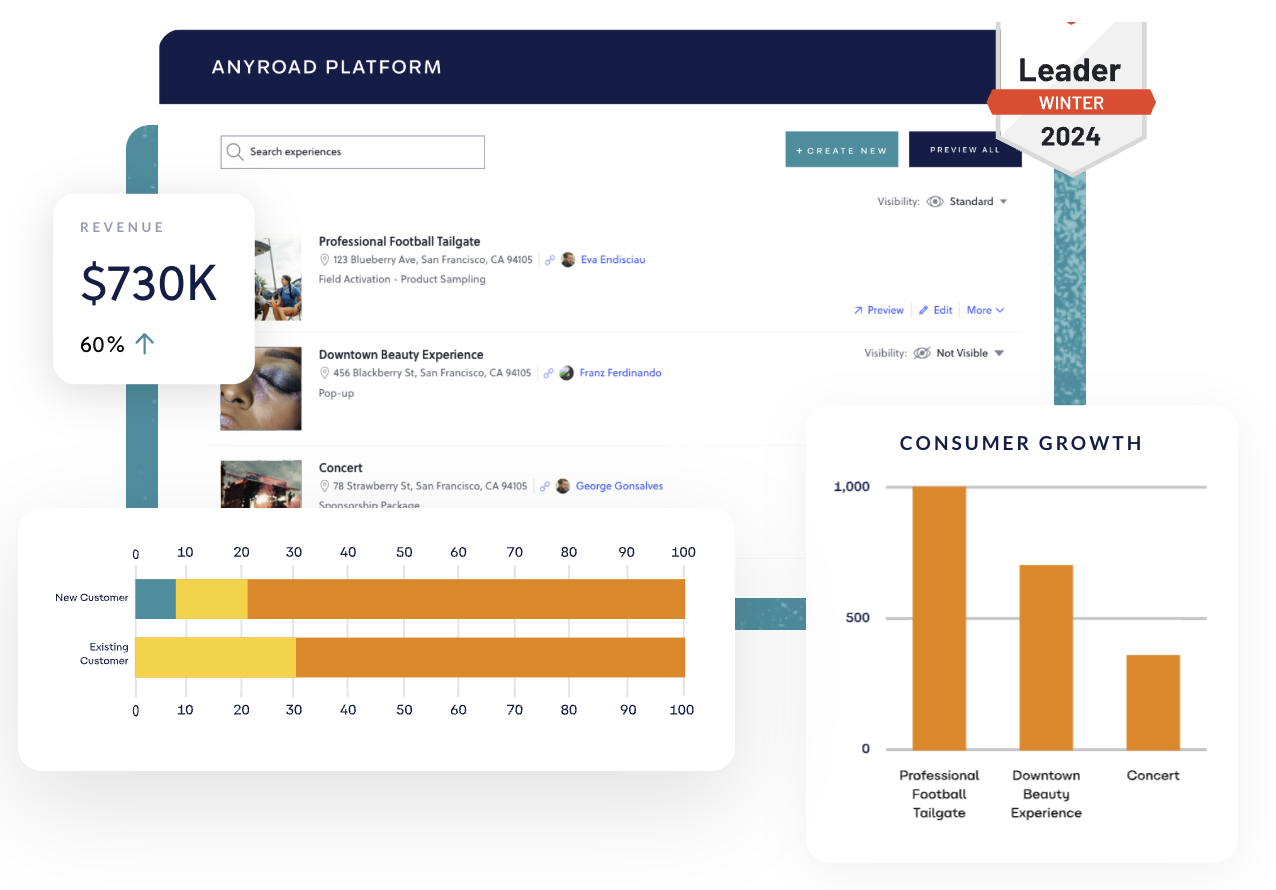
Transform your Gen Z experiences into measurable revenue. Access our KPI measurement checklist and see how to implement these 12 metrics.
Frequently Asked Questions
What makes Gen Z brand experience metrics different from traditional event KPIs?
Gen Z brand experience metrics focus on authenticity, values alignment, and social virality rather than only attendance numbers. Traditional event KPIs track basic metrics like ticket sales and headcount, while Gen Z metrics include sentiment analysis, user-generated content creation, values resonance scores, and long-term loyalty behaviors.
Gen Z consumers expect brands to demonstrate authentic purpose and create shareable moments, so measurement systems must capture emotional engagement and social amplification. These metrics also emphasize real-time responsiveness and community building, which reflects Gen Z’s preference for interactive, participatory experiences over passive consumption.
How can CPG brands calculate ROI from Gen Z experiential marketing campaigns?
CPG brands calculate experiential ROI by tracking the complete customer journey from initial experience touchpoint through long-term purchase behavior. The formula combines immediate conversion metrics with lifetime value improvements: ROI = (Direct sales + CLTV lift + Brand equity value - Campaign costs) / Campaign costs × 100.
Key components include purchase intent conversion rates, repeat purchase behavior, social media amplification value, and brand trust score improvements. Advanced platforms support attribution tracking through unique promotional codes, SMS rebate redemptions, and CRM integration that connect experiential touchpoints with retail sales data over 6 to 12 month periods.
Which Gen Z loyalty metrics predict long-term brand success beyond NPS scores?
Beyond NPS, predictive Gen Z loyalty metrics include values alignment rates, authentic engagement depth, community participation levels, and retention behavior patterns. Values alignment measures how well brand actions match stated consumer priorities such as sustainability and social responsibility. Engagement depth tracks meaningful interactions instead of passive consumption, including user-generated content creation and peer recommendation behaviors.
Community participation measures ongoing brand relationship activities like repeat event attendance, social media engagement, and advocacy actions. Retention patterns analyze purchase frequency, brand switching behavior, and response to competitive offers, which provides early indicators of loyalty erosion or strengthening.
What data capture methods work best for measuring Gen Z authenticity scores?
Effective Gen Z authenticity measurement combines real-time sentiment analysis, open-text feedback collection, and behavioral observation data. AI-powered text analysis tools process thousands of social media mentions, survey responses, and review comments to identify authentic emotional connections versus surface-level engagement.
Multi-touchpoint data collection captures feedback before, during, and after experiences through mobile surveys, social listening, and direct interaction tracking. Behavioral indicators include organic content sharing rates, unprompted brand mentions, and peer recommendation activities.
The most accurate authenticity scores come from combining quantitative engagement metrics with qualitative sentiment themes and spontaneous advocacy behaviors.
How do Gen Z experience metrics differ across CPG categories like alcohol versus food brands?
Gen Z metrics vary across CPG categories because consumption contexts, regulations, and social sharing behaviors differ. Alcohol brands focus heavily on social amplification metrics, responsible consumption messaging resonance, and premium experience justification.
Food brands emphasize taste preference shifts, ingredient transparency scores, and nutritional values alignment. Alcohol experiences often generate higher social media engagement but require careful authenticity measurement around lifestyle aspiration versus genuine product preference. Food brands can track more direct purchase intent conversion and repeat consumption patterns.
Both categories benefit from sustainability metrics, while food brands often see a stronger link between environmental values alignment and purchase behavior compared to alcohol brands, where social status and experience quality can outweigh sustainability concerns.