We use cookies to collect and analyze information on site performance and usage, provide social media features, and enhance and customize content and advertisements. Learn more
Written by: Bryan Grobstein, Vice President, Global Revenue, AnyRoad
Key Takeaways
Traditional ROI calculations overstate results by counting sales that would have happened anyway. Incremental ROI isolates true campaign lift using a control group.
The defensible formula is (Incremental Revenue − Campaign Cost) ÷ Campaign Cost × 100, where incremental revenue is measured against a holdout group.
Accurate measurement requires clean SKU-level sales data, a randomized control group, and a reliable tracking mechanism such as receipt scanning or unique promo codes.
Track redemption rate, incremental lift, new-to-brand share, customer lifetime value, and cost per redemption. Redemption rate alone functions as a vanity metric.
Before You Begin: Core Requirements for Measuring Cashback ROI
Accurate cashback ROI starts with four core prerequisites that work together as a single system.
A defined campaign objective. Trial, repeat purchase, and new customer acquisition each require a different yardstick. A trial campaign judged against repeat-purchase KPIs will always appear to underperform because the wrong metric is being applied.
Clean sales data. You need SKU-level purchase data tied to identifiable customers, not aggregate depletion reports, so you can accurately measure both test and control group sales.
The ability to create a control group. Without a holdout, there is no way to separate incremental lift from organic demand, and clean data is what makes that comparison valid.
A tracking mechanism. Receipt scanning, unique promo codes, or QR codes provide practical tracking for cashback campaigns running across retail and on-premise accounts.
This process applies during and after a campaign and fits brands running cashback offers via SMS, email, or app. It covers the formula, control group setup, key metrics, and the most common measurement errors.
Campaign cost must include reward funding, platform fees, media spend, creative production, and any operational overhead. Understating costs inflates apparent ROI.
The following worked example uses a $10 cashback rebate on a $50 bottle:
A brand runs a $10 cashback rebate on a $50 bottle across a defined customer audience.
The audience is randomly split: a test group receives the offer via SMS, and a control group does not.
After the campaign window closes, test group sales total $100,000 and control group sales total $80,000.
The 66.7% figure reflects true campaign impact. The gross revenue number of $100,000 does not reveal whether the campaign created value or simply captured demand that already existed.
How to Set Up a Control Group for Cashback Campaigns
Define the target audience. For example, customers who visited a tasting room in the last six months or purchasers of a specific SKU in the last 90 days.
Randomly split the audience. The test group receives the cashback offer and the control group does not. Random assignment is essential because self-selection biases the result.
Isolate the control group from other marketing touches. If the control group receives adjacent campaigns, the baseline becomes contaminated and the causal measurement weakens.
Measure sales for both groups over the same period. Concurrent measurement ensures both groups experience the same seasonal effects. Sequential measurement introduces noise.
AnyRoad’s platform supports this process by capturing first-party data at the point of activation, whether at a tasting room, an ambassador event inside a retail account, or an on-premise account, and by enabling audience segmentation before the offer goes out via SMS.
AnyRoad’s platform makes it easy to segment audiences and track redemptions across retail and on-premise accounts without POS integration. See the cashback rebate mechanic end to end.
Customer lifetime value (LTV): The projected revenue from a customer over time. For alcohol brands, a single bottle purchase is worth roughly $100, while a loyal club member is worth roughly $600 across six releases. Campaigns that drive repeat purchases therefore carry materially higher ROI than a single-transaction view suggests.
Cost per redemption: Total campaign cost ÷ number of redemptions. This measures efficiency and enables comparison across campaigns with different offer values.
The table below summarizes these five metrics and their formulas for quick reference during campaign planning.
Metric
Definition
Why It Matters
Redemption Rate
Claims ÷ Eligible Purchases × 100
Signals offer attractiveness and claim friction
Incremental Lift
(Test Sales − Control Sales) ÷ Control Sales × 100
Isolates true campaign impact
New-to-Brand Share
New Customer Redemptions ÷ Total Redemptions × 100
Indicates acquisition value and long-term ROI
Cost per Redemption
Total Campaign Cost ÷ Redemptions
Measures efficiency across campaigns
Incremental ROI
(Incremental Revenue − Cost) ÷ Cost × 100
The defensible number leadership requires
AnyRoad’s platform tracks these metrics automatically, including receipt-verified purchases confirmed by AI reading the receipt and matching the eligible SKU. Tracking metrics is only half the battle, though. You also need a clean data pipeline.
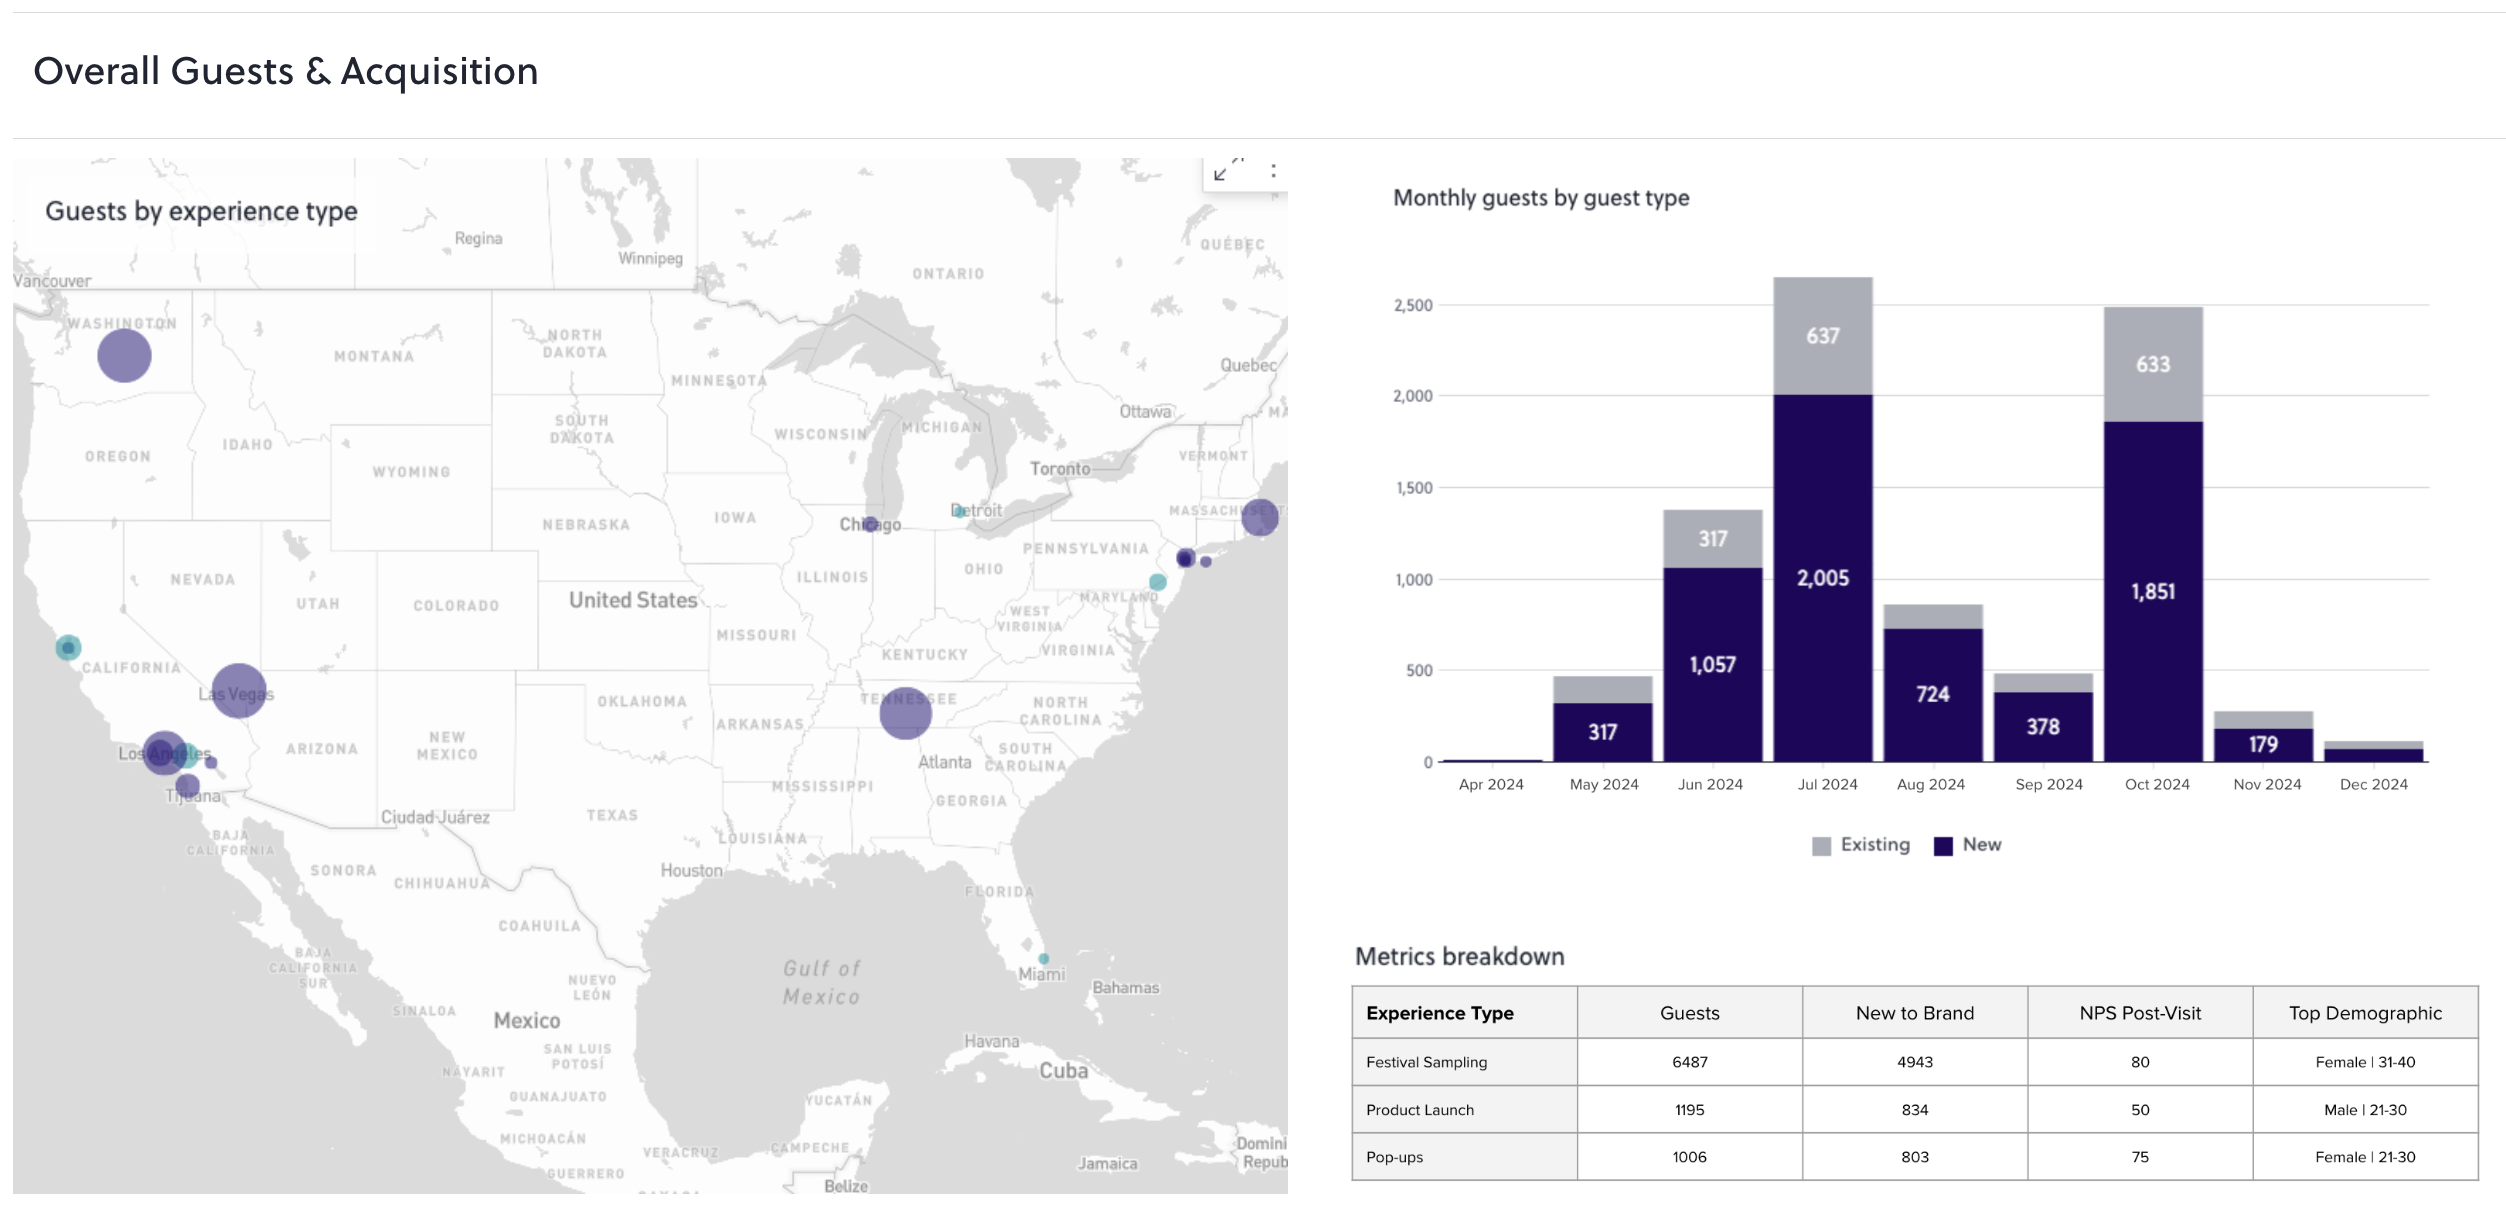
Reporting Dashboard of Guest Experience
How to Track Cashback Campaign Performance
Clean tracking underpins every reliable ROI calculation. Use this practical setup for a cashback campaign:
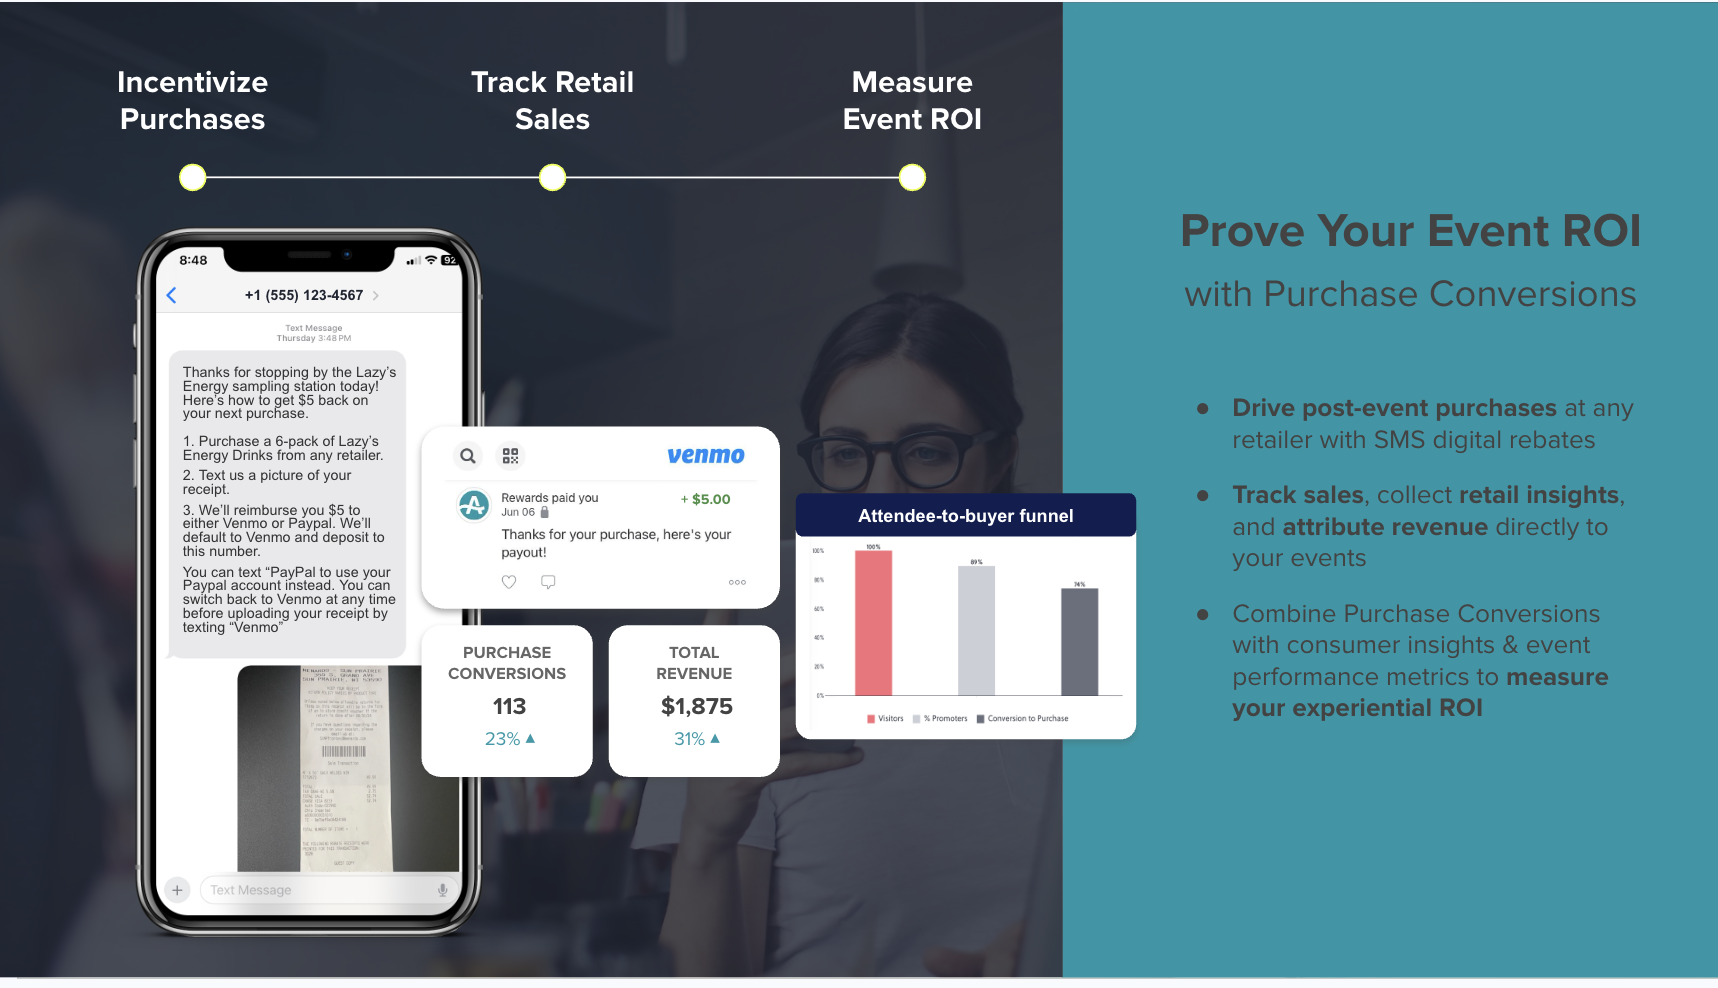
Purchase Conversions for onsite data collection and SMS campaign
Use unique promo codes or QR codes for each campaign and each audience segment so redemptions can be attributed to the correct group.
Implement receipt scanning. AnyRoad’s cashback rebate mechanic sends an SMS after registration, the consumer photographs the receipt and texts it back, and AI reads the receipt to confirm the eligible SKU. Payout goes via Venmo or PayPal. Because no POS integration is required, the mechanic works across retail and on-premise accounts at scale.
Set up analytics to capture both redemption data and sales data over the same measurement window for test and control groups.
Integrate with your CRM to link redemptions to customer profiles and track repeat purchase behavior over 6–12 months.
Cannibalization: The cashback offer shifts sales from one channel or SKU to another without growing total category volume. Measure total portfolio sales, not just the promoted SKU, and track cross-SKU impact.
Measuring too early: Running the ROI calculation before the claims window closes understates true cost and overstates return. Wait until at least 90% of expected claims have arrived.
Not segmenting new versus existing customers: If most redeemers are existing buyers, the campaign delivered repeat-purchase value rather than acquisition value. Both outcomes can be positive, but they require different ROI interpretations and different LTV assumptions.
Once you have avoided these pitfalls, the next question becomes clear: what does a good ROI actually look like?
A campaign that looks only marginally positive on immediate incremental ROI can become significantly positive once you factor in 6–12 months of repeat purchase behavior. That reality makes a strong case for tracking LTV alongside the standard incremental ROI formula.
Advanced Optimization: A/B Testing and Segmentation
Once a baseline incremental ROI methodology is in place, the next step involves structured optimization. A/B testing different rebate amounts against matched control groups reveals the face value that maximizes incremental lift per dollar of reward cost. Because redemption rate rises predictably with face value, a higher offer costs more per redemption but may drive meaningfully higher incremental lift. Testing provides the only reliable answer.
Targeting high-value segments such as repeat visitors, high-NPS customers, or customers approaching a loyalty tier threshold concentrates the offer on the audience most likely to generate incremental lift rather than simply rewarding purchases that would have happened anyway. AnyRoad’s platform surfaces these segments using first-party data captured at tasting rooms, ambassador events, and on-premise activations, which enables precise audience selection before the SMS goes out.
Integrating cashback campaigns with a loyalty or club program extends the measurement horizon. A consumer who redeems a cashback offer and then enrolls in a bottle club moves from a roughly $100 transaction value to a roughly $600 lifetime value. A single-campaign ROI calculation will not capture that shift without a 12-month LTV tracking window.
Frequently Asked Questions
What is the difference between simple ROI and incremental ROI for cashback campaigns?
Simple ROI divides all revenue attributed to the campaign by campaign cost. It counts every sale that touched the promotion, including purchases from customers who would have bought the product without the offer. Incremental ROI measures only the lift caused by the campaign, using a control group to establish what sales would have looked like without the promotion. The difference between the two figures represents the portion of revenue that was already going to happen regardless. Incremental ROI gives leadership a defensible number because it isolates true campaign impact rather than crediting the campaign for organic demand.
How do I set up a control group for a cashback campaign?
Start by defining the target audience, such as customers who purchased a specific SKU in the last 90 days or visited a tasting room in the last six months. Randomly split that audience into a test group that receives the cashback offer and a control group that does not. Keep the control group at 10–20% of the total audience for most campaigns, and ensure it is large enough to reach statistical significance, typically several hundred conversions per group. Run both groups concurrently over the same period so seasonal effects remain equal. Keep the control group isolated from other marketing touches to avoid contaminating the baseline. Measure sales for both groups over the same window, and extend the measurement period past the campaign end date to capture late claims and detect any post-promotion demand dip.
What is a good redemption rate for a cashback campaign?
Redemption rates vary significantly by offer value and claim mechanic. Benchmarks for specific offer values appear in the metrics section above. A healthy benchmark for cashback and reward redemption across many programs is 20–30%, with rates below 10% signaling a problem with offer value, claim friction, or both. Digital redemption mechanics, such as receipt scanning with mobile payout via Venmo or PayPal, materially outperform traditional mail-in rebates because they reduce the effort required to claim. Always evaluate redemption rate alongside incremental lift and new-to-brand share rather than in isolation.
What costs should I include in a cashback campaign ROI calculation?
Every cost tied to the campaign belongs in the denominator: rebate amounts paid out, platform fees, media spend used to promote the offer, creative production costs, SMS or email delivery costs, and any internal operational overhead. For campaigns running through a third-party redemption platform, include placement or commission fees. Understating costs is a common measurement error that produces an ROI figure that will not survive a finance review. If the campaign uses a pay-on-activation model rather than a pay-on-send model, the realized reward cost will reflect actual redemptions rather than total eligible recipients, which matters for accurate cost accounting.
How long should I measure cashback campaign ROI?
The measurement window has two components. For the immediate campaign ROI, wait until at least 90% of expected claims have been submitted before running the final calculation, as noted earlier, wait 6 to 8 weeks after the campaign end date. Running the calculation too early understates true cost and overstates return. For LTV impact, track repeat purchase behavior over 6 to 12 months to determine whether the campaign drove lasting behavior change or simply pulled forward demand. A campaign that appears marginally positive on immediate incremental ROI can be significantly positive once repeat purchase value is factored in, particularly for alcohol brands where the difference between a one-time buyer and a club member is roughly $500 in lifetime value.
Can cashback campaigns work for on-premise alcohol accounts?
Yes. AnyRoad’s receipt-scanning mechanic works anywhere the product is sold, including bars and restaurants, without requiring POS integration. The consumer registers via QR code at the point of activation, receives an SMS with the cashback offer, photographs the receipt after purchase, and texts it back. AnyRoad’s AI reads the receipt, confirms the eligible SKU, including a line-item SKU on a bar tab, and pays out via Venmo or PayPal. This approach makes on-premise conversion tracking possible in a way that depletion reports never could because it ties the activation directly to a verified individual purchase rather than aggregate volume movement.
Conclusion
Measuring cash back campaign ROI with confidence requires three elements: an incremental methodology that uses a control group, a complete cost figure that includes every expense tied to the campaign, and a measurement window long enough to capture late claims and post-campaign behavior. Simple attribution will always overstate return by counting sales that were already going to happen. The incremental formula, (Incremental Revenue − Campaign Cost) ÷ Campaign Cost × 100, produces a number that reflects true campaign lift and holds up under scrutiny from finance.
For alcohol and CPG brands, the LTV dimension adds another layer. A cashback campaign that converts a first-time buyer into a repeat purchaser or a club member generates returns that extend well beyond the campaign window. Tracking that value requires connecting the redemption record to a customer profile and following purchase behavior over 6 to 12 months. That first-party data infrastructure turns a one-time promotion into a scalable acquisition channel.