


Written by: Bryan Grobstein, Vice President, Global Revenue, AnyRoad
Key Takeaways for Festival Dwell Time
- Traditional festival recaps rely on foot traffic and a single average dwell time, which hides real engagement patterns and weakens links to purchase intent.
- Define three physical zones — Attraction, Engagement, and Conversion — plus a minimum 30-second engaged-dwell threshold to keep measurements consistent and comparable across events.
- Combine AI vision sensors for passive dwell tracking with QR code check-ins for first-party capture so you get both behavioral depth and individual identity without pre-issued wearables.
- Report five core metrics — median dwell, dwell distribution, participation rate, throughput, and conversion to purchase intent — instead of a lone average to pinpoint where the activation wins or leaks attention.
- AnyRoad’s platform turns these dwell insights into automated, defensible ROI reports and first-party records that feed directly into CRM and loyalty programs. See how automated ROI reporting works to prove festival spend drives revenue.
Step 1: Define Visit Boundaries and Engaged Dwell
Clear physical and definitional boundaries keep dwell numbers consistent across events. Without them, every technology produces different, non-comparable results.
Define three zones before the activation is built:
- Attraction Zone: The outer perimeter where passersby first notice the activation. A strong attraction zone pulls in passersby and creates a brief initial dwell.
- Engagement Zone: The interior area containing product interaction, sampling, or experiential touchpoints. This zone should include multiple touchpoints and support several minutes of dwell.
- Conversion Zone: The area where data capture, purchase intent surveys, or enrollment offers occur. A clear conversion zone supports efficient interaction and data capture.
Once zones are defined, set what counts as engaged dwell versus transit. A visitor who crosses the attraction zone boundary and exits in under 10 seconds is a pass-through, not an engaged visitor. Set a minimum threshold, typically 30 seconds inside the engagement zone, before a visit is counted in your dwell distribution. Zone-based dwell time tracking is more valuable than total stand dwell time because it reveals where an experience is winning or leaking attention, such as visitors spending 90 seconds entering an activation but only 12 seconds at the product messaging wall.
Step 2: Choose the Right Capture Technology Mix
Different festival environments call for different capture setups. Infrastructure, budget, connectivity, and your priority on passive behavior versus active first-party data all shape the right choice. The strongest dwell time tracking setups combine passive measurement with active interaction data, because single data sources can mislead in messy live environments where crowds bunch and visitors move between zones.
| Technology | Dwell Accuracy | First-Party Data Capture | Key Limitation |
|---|---|---|---|
| RFID / NFC Badges | Exact entry/exit timestamps, room-level accuracy | Badge linked to registration record at enrollment | Passive RFID read accuracy can drop in crowds due to shadowing, while NFC requires deliberate action and can create queues. |
| AI Vision Sensors (e.g., computer vision cameras) | Heat maps, dwell-time charts, and zone performance comparisons; operates fully offline | No PII captured; aggregate demographic estimates only | Cannot link behavioral data to an individual record without a separate capture step. |
| QR Code Check-Ins | Captures only entry events; provides no dwell time measurement | High: captures name, email, opt-in, and custom survey fields at scan | Requires active participation and measures entry, not duration. |
| Staff Sampling (intercept surveys) | Estimated; subject to selection bias and staff availability | High: staff can capture rich qualitative data and consent | Not scalable and cannot produce statistically reliable dwell distributions across a full activation footprint. |
Given these trade-offs, most festival activations without pre-issued wearables benefit from a hybrid approach. Use AI vision sensors for passive behavioral measurement and pair them with QR code check-ins for first-party capture. Beacon technology provides live data on attendee locations, linger times, skipped areas, and repeat traffic, which has been used to evolve event layouts year to year and prioritize items to increase engagement, so it works as a third layer where festival infrastructure supports it.

Step 3: Calculate and Report the Five Core Metrics
Reporting a single average dwell time is the most common measurement error in festival activation recaps. Dwell time distribution, not average dwell time, is the core engagement metric, because a flat average hides the curve of how many participants lingered for seconds versus several minutes. The five metrics below replace the average with a complete picture.
| Metric | Definition | Why It Matters | How to Calculate |
|---|---|---|---|
| Median Dwell Time | The dwell time at the 50th percentile of all engaged visits. | The median better represents the typical visitor in skewed distributions than the mean, which is distorted by extreme observations. | Rank all engaged visit durations and take the middle value. |
| Dwell Distribution | Percentage of visits falling into defined duration buckets, such as under 60 seconds, 1–3 minutes, 3–5 minutes, and 5+ minutes. | A distribution showing 80% of visits below 60 seconds and 20% above three minutes identifies a high-engagement minority and a majority whose engagement model needs redesign. | Bin all engaged visit durations and report the share in each bucket. |
| Participation Rate | Share of total passersby who cross the engagement zone boundary and meet the minimum dwell threshold. | Participation rate is the key denominator for assessing activation efficiency and for calculating all subsequent metrics such as leads captured. | Engaged visitors divided by total passersby counted in the attraction zone. |
| Throughput | Number of engaged visitors processed per hour at peak and off-peak periods. | Real-time engagement data allows operational adjustments during multi-day events, such as adding staff during peak periods or shifting layouts to address congestion points. | Engaged visits per hour, segmented by time block across the event day. |
| Conversion to Purchase Intent | Percentage of engaged visitors who report intent to purchase in a post-interaction survey. | Longer dwell times within brand activations can correlate with higher purchase intent. | Post-interaction survey responses indicating purchase intent divided by total survey respondents. |
Step 4: Set Target Dwell and Throughput Benchmarks
Benchmarks give the dwell distribution context so teams can judge performance. Without a reference point, a median dwell of 4 minutes has no clear meaning.
For festival-specific activations, average dwell time typically falls in the five to six minute range for booths and activations on a busy show floor, while activations that stand out hold people for 10 minutes or more.
The Event Marketing Measurement Association (EMMA) offers practitioner-level guidance on dwell benchmarking for brand activations. Use EMMA's framework with your own historical data to set targets that match your category, activation format, and festival type instead of relying only on cross-sector averages.
Set three benchmark tiers for each activation, each representing a different level of activation maturity:
- Minimum viable engagement: This tier establishes the floor. Aim for median dwell above 2 minutes, with at least 20% of visits exceeding 5 minutes, the point where purchase intent begins to form at measurable rates.
- Target performance: This tier represents a well-tuned activation. Aim for median dwell of 4–6 minutes, participation rate above 30%, and conversion-to-purchase-intent above 60%. These levels indicate that visitors move through the full engagement journey.
- Top-decile performance: This tier reflects best-in-class execution. Aim for median dwell above 10 minutes while maintaining throughput above 40 engaged visitors per hour at peak to show both deep engagement and operational efficiency.
Optimal occupancy sits at 60–70% of activation capacity; below 60% the space feels empty, while above 70% avoidance behaviors shorten visits and reduce data capture. Throughput targets should respect this range.
Step 5: Feed Dwell Data into First-Party Capture and ROI Reporting
Dwell time data creates value only when attached to an individual record. At this step, behavioral measurement turns into first-party data and festival spend becomes defensible ROI.
The connection works in a simple sequence. A visitor who meets the minimum dwell threshold in the engagement zone receives a prompt from staff, a QR code, or an interactive touchpoint to complete a data capture action. That action creates a record containing contact information, marketing opt-in status, and a purchase intent signal. The dwell duration and zone sequence from the passive measurement layer then attach to that record.
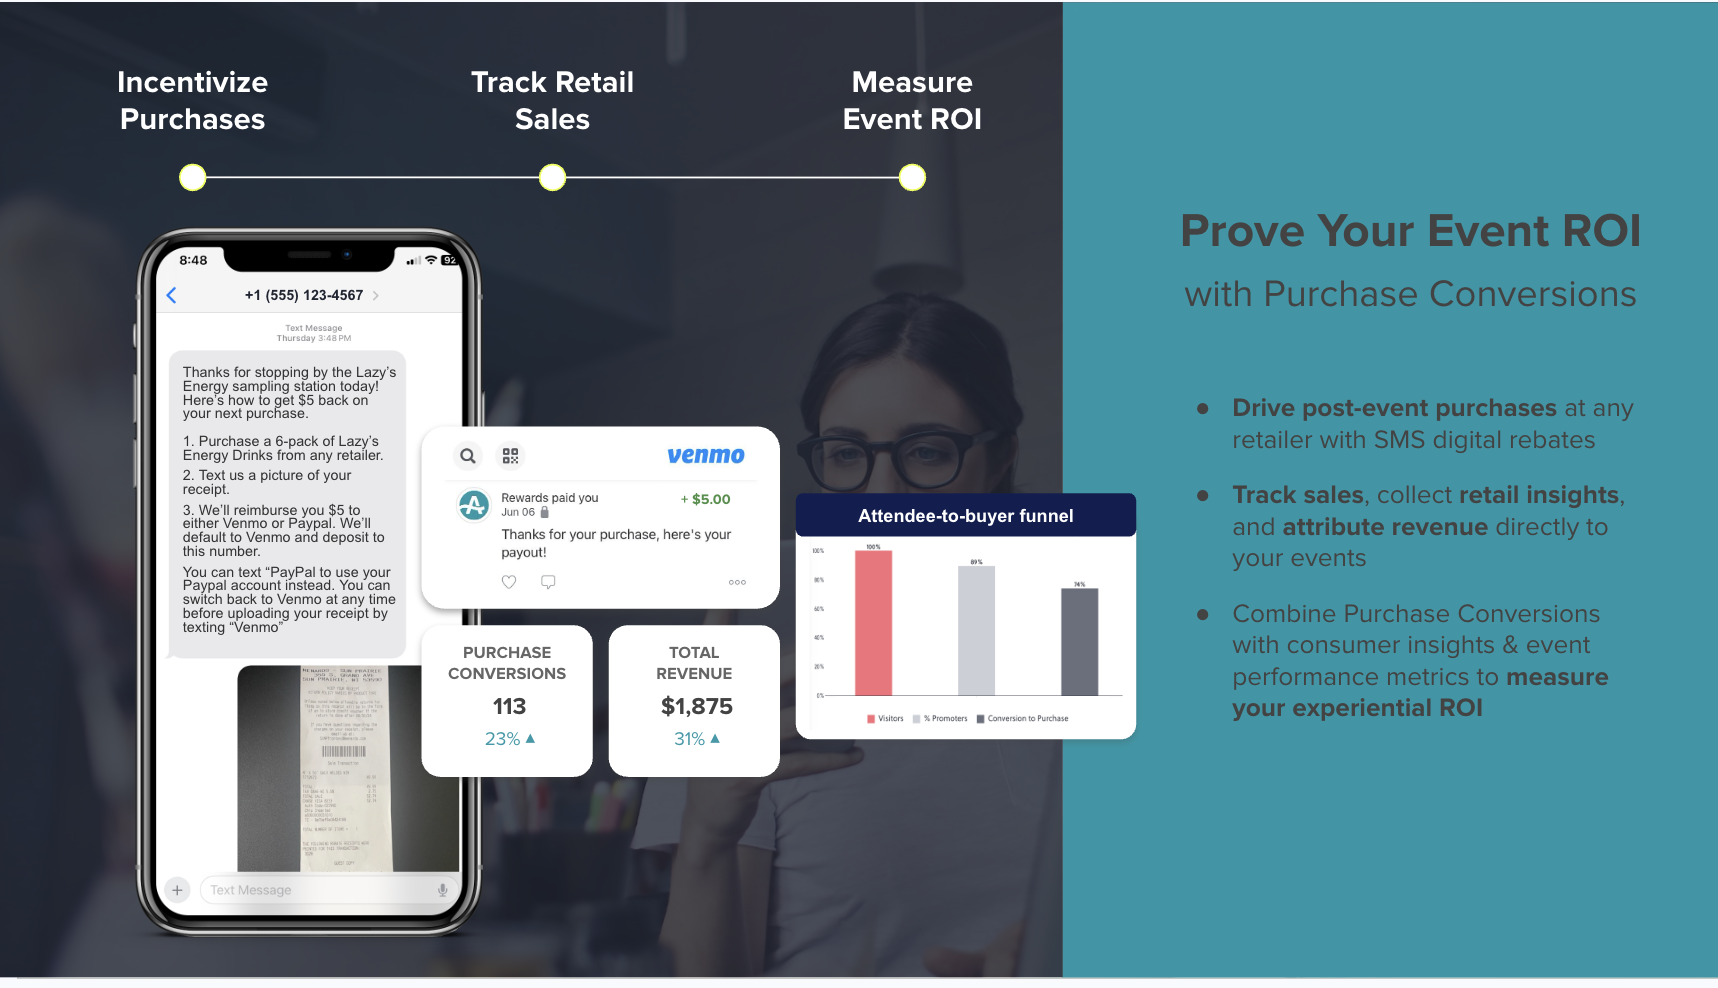
The result is a first-party profile that shows who the person is and how deeply they engaged before opting in. In festival activations at III Points and Portola, agency POPLIFE captured 45–50% more consumer data using this approach compared to competitors, with 42% of attendees opting into future marketing communications and 85% of engaged consumers reporting post-event purchase intent. The same automated reporting system generated detailed event success reports in approximately 20 minutes.
Those records then feed directly into ROI reporting for cost per engaged visitor, cost per opted-in lead, and cost per purchase-intent conversion. Each metric traces back to the dwell distribution data captured in Step 3.
AnyRoad's platform executes this final step at scale, capturing first-party data at the activation, appending behavioral signals, and producing automated ROI reports without requiring an internal data team to stitch together the output. See how to automate first-party capture and ROI reporting without a data team.

Operational Realities: Staffing, Logistics, and Compliance
Technology choices define what data you could capture, while staffing determines what you actually capture.
For QR-based capture, every staff member at the conversion zone needs a consistent script for prompting the scan. Inconsistent prompting produces inconsistent capture rates that distort the participation rate metric. Train staff on the minimum dwell threshold so they avoid prompting a visitor who has been in the engagement zone for under 30 seconds, because that visit will not meet the engaged-dwell definition and will inflate the denominator.
For AI vision sensors, position cameras to cover the full engagement zone perimeter with clear sightlines. As noted earlier, these systems process behavioral signals locally on-device, which makes them suitable for high-traffic festival environments with limited connectivity.
For data capture compliance, keep opt-in language visible at the point of capture and ensure that privacy policies are easy to access. For alcohol brands, age verification at the point of data capture is a compliance requirement. Platforms with integrated ID scanning handle this within the capture flow instead of as a separate manual check.
Troubleshooting Common Measurement Errors
Several systematic errors appear repeatedly in festival activation measurement, and each one can distort dwell insights.
- Counting transit as engagement: Visitors who cross the activation boundary without stopping inflate participation rate and deflate median dwell. Apply the minimum dwell threshold defined in Step 1 before counting any visit.
- Reporting mean instead of median: A small number of very long visits from staff, brand ambassadors, or superfans pull the mean upward and misrepresent typical visitor behavior. Always report median alongside distribution buckets.
- Mixing zone data into a single figure: Aggregating dwell across all zones into one number hides where the activation loses attention. Zone-based tracking reveals whether visitors are spending 90 seconds entering an activation but only 12 seconds at the product messaging wall, a pattern that a single aggregate figure would never surface.
- Ignoring occupancy: If dwell times drop sharply during peak hours, check whether occupancy has exceeded the 70% threshold discussed in Step 4 before attributing the decline to content or design.
- Conflating friction dwell with productive dwell: Distinguishing productive dwell, such as active browsing and product interaction, from friction dwell, such as time lost to confusing layouts or slow checkout, enables targeted operational changes that improve conversion outcomes.
Advanced Tips: Automation, Segmentation, and Workflow Integration
Once the five-step process runs consistently, three extensions increase its value significantly.
Automate distribution reporting. Manual dwell calculations from exported sensor logs are slow and error-prone. Platforms that ingest raw timestamp data and output distribution charts automatically cut reporting time from hours to minutes. POPLIFE generated detailed reports on event success in around 20 minutes using automated reporting and centralized data.

Segment by dwell tier. First-party records with appended dwell data can be segmented into engagement cohorts, such as visitors who reached the 5-minute threshold, visitors who completed the full conversion zone interaction, and visitors who opted in but did not reach the engagement zone minimum. Each cohort warrants a different follow-up sequence. MoZeus activations report average opt-in rates of 35–55% when data capture is built into the experience, which provides a realistic baseline for segmentation volume planning.
Integrate with downstream systems. Dwell-segmented first-party records create the most value when they flow directly into a CRM or marketing automation platform without manual export. Webhook and API integrations between the capture platform and tools like HubSpot, Klaviyo, or Salesforce enable immediate follow-up triggered by engagement tier instead of a generic post-event blast.
Conclusion: Turn Festival Dwell Time into Revenue Proof
The five-step process of defining boundaries, selecting capture technology, reporting distribution metrics, setting benchmarks, and feeding data into first-party records replaces the single-average recap with a measurement system that produces defensible numbers and connects festival spend to purchase intent outcomes.
Dwell time is the most honest engagement signal available at a festival activation. Foot traffic shows reach. Dwell time distribution shows whether the activation held attention long enough to move someone from awareness to consideration to intent. First-party records with dwell data appended show whether that intent translated into an identifiable person who can be reached again.
AnyRoad's experiential marketing platform executes Step 5 at scale, capturing first-party data at the activation, appending behavioral signals, producing automated ROI reports, and feeding opted-in records into downstream loyalty and CRM programs without requiring an internal data team to operate it. See how to prove retail sales impact from your festival activations.
Frequently Asked Questions
How do average dwell time and dwell time distribution differ for festival activations?
Average dwell time is a single number calculated by dividing total time spent by total visitors. It is easy to report but hides the actual shape of engagement at an activation. Dwell time distribution breaks visits into duration buckets, such as under 60 seconds, 1–3 minutes, 3–5 minutes, and 5 or more minutes, and shows the percentage of visits in each bucket. This matters because a 3-minute average looks identical whether every visitor stayed exactly 3 minutes or whether 90% left in 30 seconds and 10% stayed for 15 minutes. Those two scenarios have completely different implications for activation design, staffing, and follow-up strategy. Distribution analysis also shows the share of visitors who crossed the purchase-intent threshold, typically 5 minutes or more, and allows teams to track whether activation changes move that share up or down over time.
How does dwell time connect to purchase intent at festival brand activations?
The relationship between dwell time and purchase intent is non-linear. Short visits under 30 seconds usually build only passive brand awareness. Visits in the 30-second to 2-minute range build consideration. Visits in the 2–5 minute range build emotional connection. Visits exceeding 5 minutes are where purchase intent forms at a meaningfully higher rate, and visits beyond 8 minutes begin to create advocacy potential. This progression means the goal of activation design is not simply to maximize average dwell time but to move the largest possible share of engaged visitors past the 5-minute threshold. Connecting dwell data to post-interaction purchase intent surveys, and then to downstream purchase records via first-party capture, allows brands to validate this relationship with their own audience data instead of relying only on industry benchmarks.
What first-party data should a festival activation capture alongside dwell time?
A festival activation should capture at minimum name, email address, marketing opt-in status, and a purchase intent signal, typically a single survey question asked at the conversion zone. Beyond that minimum, the most valuable additional fields include zip code or market for retail distribution planning, product preference or flavor profile for personalization, and age verification confirmation for alcohol brands. The dwell duration and zone sequence from passive measurement should be appended to each record as behavioral metadata. This combination produces a first-party profile that includes contact information and a behavioral signal indicating how deeply the person engaged before they opted in, which makes post-event segmentation and follow-up sequences more effective than a generic post-event email blast.
How should a field marketing manager set realistic dwell time benchmarks for a festival activation?
A field marketing manager should set benchmarks at three levels: a minimum viable engagement threshold, a target performance level, and a top-decile aspiration. The minimum viable threshold for most festival activations is a median dwell above 2 minutes, with at least 20% of visits exceeding 5 minutes. Target performance for a well-designed activation is a median dwell of 4–6 minutes, a participation rate above 30% of passersby, and a conversion-to-purchase-intent rate above 60% of survey respondents. Top-decile performance, based on industry sensor data across thousands of events, involves median dwell above 10 minutes with throughput maintained above 40 engaged visitors per hour at peak. These benchmarks should be adjusted based on activation format, festival audience density, and historical data from prior activations. A brand running its third year at the same festival has a more reliable baseline than one measuring for the first time.
Can dwell time measurement work at festivals without pre-issued wearables or RFID infrastructure?
Dwell time measurement can work effectively without pre-issued wearables or RFID infrastructure. The most practical combination for these festivals is AI vision sensors for passive behavioral measurement paired with QR code check-ins for first-party data capture. AI vision systems using computer vision cameras can measure dwell time, zone transitions, heat maps, and visitor counts without capturing any personally identifiable information, and modern systems operate fully offline without requiring a stable internet connection, which matters in high-traffic festival environments. QR code check-ins do not measure dwell time on their own, but they create the first-party record to which behavioral data from the passive layer can be appended. Staff intercept sampling can supplement both layers for qualitative context, although it cannot produce statistically reliable dwell distributions across a full activation footprint on its own. The key is combining at least one passive measurement source with at least one active capture mechanism so that behavioral depth and individual identity both appear in the final dataset.