


Written by: Bryan Grobstein, Vice President, Global Revenue, AnyRoad
Key Takeaways
- Build a pre-festival measurement plan that locks objectives, attribution window, CRM tagging, and a three-layer reporting model so ROI stands up to scrutiny.
- Map the full eight-stage funnel from reach through amplification and track specific metrics at each stage to connect activations to revenue.
- Tag every asset with festival-specific QR codes, zone-level promo codes, and CRM source tags before the event to avoid blended post-event numbers.
- Report financial ROI, behavioral outcomes, and brand lift as separate layers with methodology notes so finance and brand leadership can evaluate each independently.
- Use AnyRoad to capture first-party data from every attendee, connect opt-ins to receipt-verified purchases without POS integration, and turn open-text feedback into brand-lift evidence.
Step 1: Build The Festival Marketing Measurement Plan Before The Event
The measurement plan is a document circulated and agreed to before the activation launches. That pre-commitment makes the resulting number defensible when leadership reviews it.
Assign a named owner first, such as a field marketing manager or experiential lead. That person needs access to the CRM, web analytics, and the signed-off activation budget, because they must trace every opt-in back to revenue. Their first job is to get finance or leadership to agree on what “ROI” means for this specific activation so the number is not debated after the event.
Lock four decisions before the festival:
- Objectives And KPIs. Define what the festival should accomplish: awareness, first-party data capture, trial, purchase intent, or retail sell-through. A single activation cannot prioritize all of these equally, so choose the primary outcome and report the rest as supporting metrics.
- The Attribution Window. Define it explicitly and in writing. For high-consideration campaigns, a 30–90 day click window reconciled with CRM outcomes is the practical standard. Short windows undercount delayed purchases. Long windows over-credit the activation. Match the window to the product’s purchase cycle.
- CRM Source Structure. Decide how the festival will be tagged as a source in the CRM so every record traces back to the activation. Use specific source tags that identify the stage, booth, or tasting that produced each opt-in.
- The Reporting Format Leadership Will See. Agree on the three-layer model of financial ROI, behavioral outcomes, and brand lift before the event. When leadership accepts the format in advance, they focus on the results instead of re-arguing the methodology.
This process applies to any festival activation format: a brand-owned stage, a sampling booth, an ambassador tasting, or a sponsored lounge.
Prove Future Retail Sales Impact From Your Experiences. Schedule A Demo.
Step 2: Map The Festival Measurement Funnel
A festival activation touches consumers at multiple stages, and each stage needs its own metric and measurement method. The eight stages below form the complete funnel:
- Reach. Foot traffic and impressions, meaning the total number of people who could have encountered the activation.
- Engagement. Interactions, dwell time, and samples poured, representing the subset who stopped and participated.
- Capture. Opt-ins, QR scans, and first-party records, covering the consumers who provided identifiable data.
- Intent. Survey responses, purchase intent scores, and NPS, showing what captured consumers say they plan to do next.
- Conversion. Receipt-verified purchases, promo code redemptions, and club enrollments, showing what they actually did.
- Post-Event. Attributed revenue inside the pre-committed attribution window, representing the financial output of the activation.
- Brand Impact. Awareness, consideration, favorability, and purchase intent lift, measured against a pre-event baseline.
- Amplification. Earned social, UGC, and referral, capturing the organic extension of the activation beyond the festival footprint.
The table below maps each stage to its specific metrics and the measurement mechanism that produces them, so the team knows exactly what to instrument before the festival opens.
| Stage | Metrics | How To Measure |
|---|---|---|
| Reach | Foot traffic, impressions | Digital counters or QR entry gates at the activation perimeter, plus hourly counts logged by staff |
| Engagement | Interactions, dwell time, samples poured | Timed activity stations or RFID badge scans, and samples distributed per active labor hour |
| Capture | Opt-ins, QR scans, first-party records | Festival-specific QR codes and registration flows that capture every attendee in a group |
| Intent | Survey responses, purchase intent, NPS | Post-interaction mobile survey compared against baseline brand NPS |
| Conversion | Receipt-verified purchases, promo redemptions, club enrollments | Unique promo codes per zone and a receipt-based cashback rebate tied to an identifiable SKU |
| Post-Event | Attributed revenue inside the window | CRM source tag joined to transaction records within the pre-committed attribution window |
| Brand Impact | Awareness, consideration, favorability lift | Pre and post survey with exposed and control cohorts |
| Amplification | Earned social, UGC, referral | Branded hashtag and geotag monitoring during and after the event |
AnyRoad’s platform operationalizes this funnel. Its FullView feature captures data from every attendee in a group, which turns a partial opt-in list into a complete first-party record. In a 2023 festival activation at III Points and Portola, agency POPLIFE used AnyRoad to capture 45–50% more consumer data than competitors, with 42% of attendees opting into future marketing communications and 85% reporting post-event purchase intent.
Step 3: Tag Every Asset Before You Leave The Office
Operational tagging is where measurement plans fail most often. Five assets must be configured before the festival: festival-specific QR codes, unique promo codes per activation zone, UTM-tagged landing pages, CRM source tags, and POS integration where the venue supports it.

Festival-specific tagging matters because a generic QR code cannot identify which stage, booth, or tasting produced the opt-in. A generic promo code cannot be attributed to a single activation zone. Without zone-level tagging, post-event analysis produces a blended number that no team can improve.
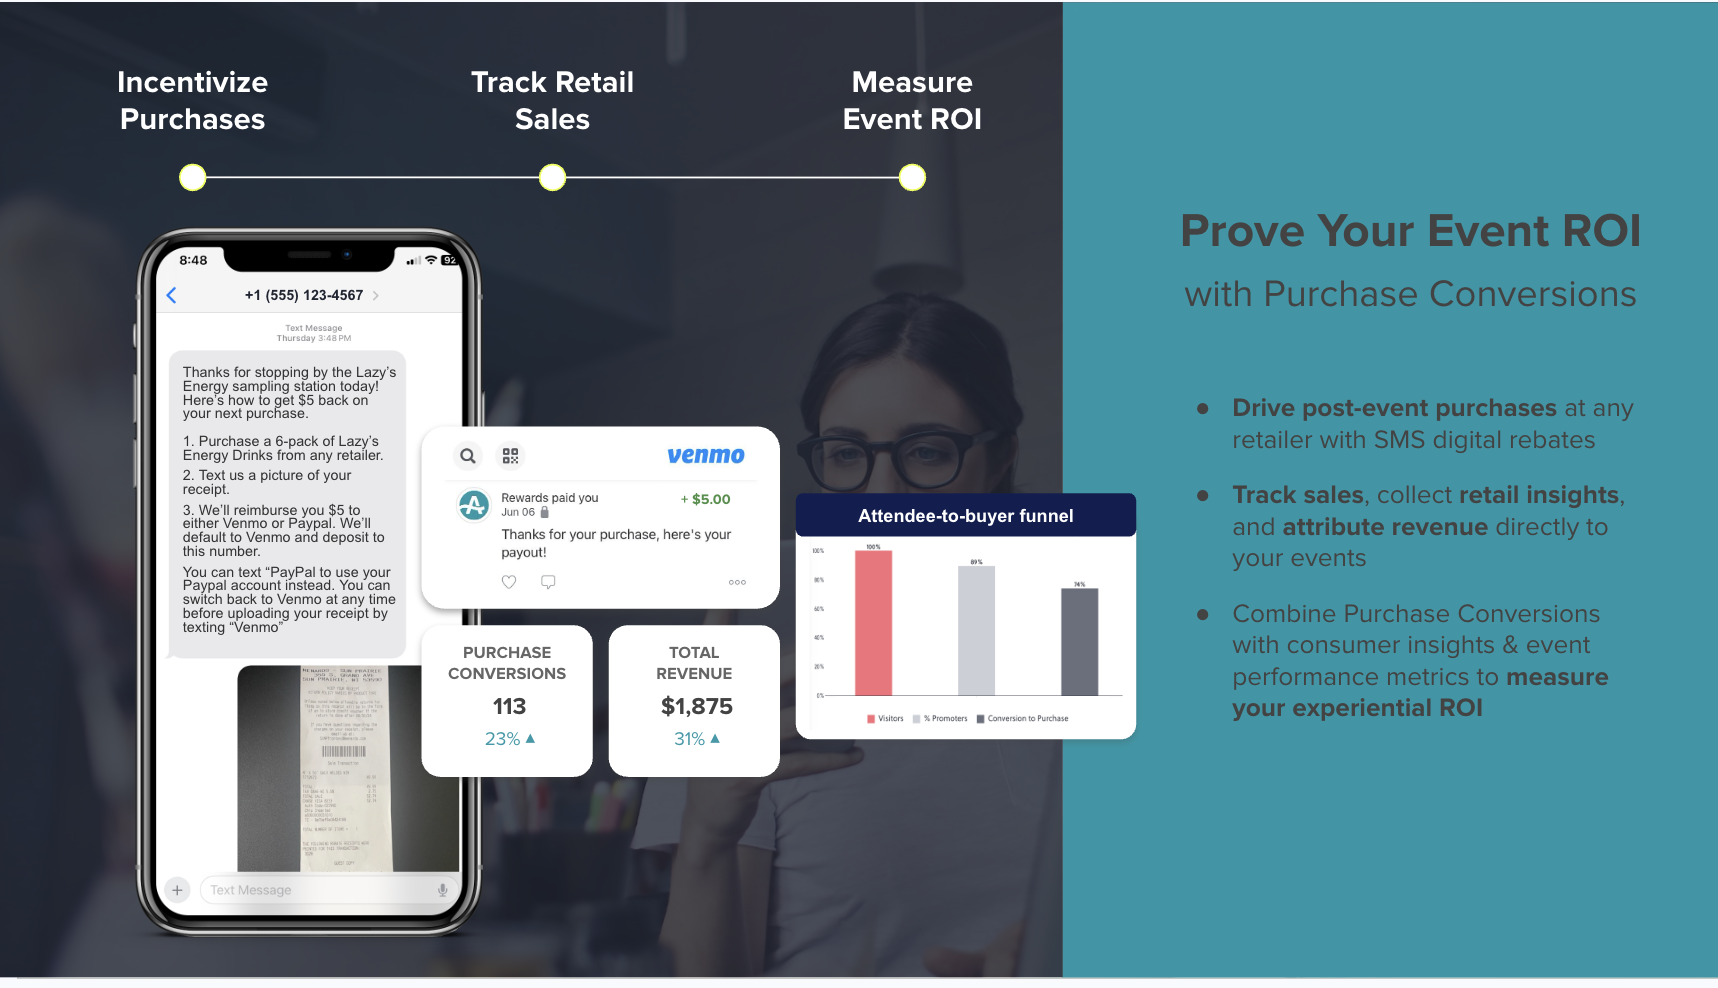
On-premise and third-party retail activations need a specific approach. When the activation happens inside an account the brand does not own, such as an ambassador tasting at a retailer or a bar, a receipt-based cashback rebate tied to an identifiable SKU becomes the most reliable measure. AnyRoad’s cashback rebate mechanic works without POS integration from the retailer. The consumer receives an SMS with a rebate offer, photographs the receipt, and texts it back. AnyRoad’s AI reads the receipt, confirms the eligible SKU, and pays out via Venmo or PayPal. Every redemption produces a first-party record tied to a verified purchase, which connects experiential spend to retail sell-through at scale.
Alcohol brands also need a tagging plan that covers compliance. Age verification and ID scanning at capture points must work alongside privacy and opt-in language that satisfies federal and state requirements. AnyRoad’s integrated ID scanning handles embedded age verification at the point of data capture.
See Which Bottles Your Activation Actually Sold. Schedule A Demo.
With the plan built, the funnel mapped, and every asset tagged, the next step is turning those inputs into a single defensible ROI number.
Step 4: Calculate ROI For A Festival Activation
ROI for a festival activation uses a simple formula: ROI = (attributed revenue − total activation cost) / total activation cost. The denominator must include the full cost side, including booth build, staffing, travel, samples, media, and the measurement tooling itself. Leaving out indirect costs understates the true denominator and inflates the reported ratio.
The following example is illustrative only and should not be treated as a benchmark. A hypothetical festival activation has a $150,000 budget. It reaches 50,000 attendees and generates 2,000 meaningful interactions. Of those, 700 opt in, and 180 make receipt-verified purchases within a 90-day attribution window. If the average purchase value is $45 and gross margin is 60%, attributed contribution margin is 180 × $45 × 0.60 = $4,860. ROI = ($4,860 − $150,000) / $150,000 = −96.8%. That number looks alarming and should prompt a conversation about what the activation was designed to achieve. When the objective centers on data capture and brand lift instead of immediate purchase conversion, the financial ROI line becomes one part of the story rather than the primary success metric. That is the role of the three-layer reporting model.
Incrementality then becomes the key question. Correlated revenue happened after the festival. Incremental revenue would not have happened without it, and only that portion belongs in a defensible ROI numerator.
Teams can estimate incrementality without a full control group. Difference-in-differences analysis compares treatment and control markets over the same period and isolates the activation’s effect from seasonal lift and other market influences. Pre and post surveys with exposed and unexposed cohorts measure whether the activation shifted purchase intent beyond what the unexposed group experienced. Holdout markets, where the activation did not run, provide a behavioral baseline. If turning off a campaign does not cause revenue to drop, the campaign was not driving incremental value. Each of these methods improves the estimate compared with assuming all post-event sales are incremental.
Brand lift sits alongside this financial view and deserves its own step in the plan.
Step 5: Measure Brand Lift Separately
Brand lift belongs in its own reporting layer, separate from the hard-dollar ROI number. When teams blend them, they create a figure that satisfies neither finance nor brand leadership.
The methodology for measuring brand lift at a festival activation follows the logic of any brand lift study. Survey an exposed group and a matched control group. Use the pre-event survey to establish the baseline. Field the post-event survey within the attribution window to measure the shift. The difference between the exposed group’s scores and the control group’s scores is the brand lift attributable to the activation.
Report brand lift as a separate line in the leadership dashboard with its own methodology note. Leadership should see the financial number and the brand number side by side and understand how each was produced.
Open-text survey responses from festival guests add a qualitative layer that strengthens the brand lift case. AnyRoad’s PinPoint AI analyzes thousands of open-text responses to identify themes, sentiment drivers, and actionable patterns. That analysis turns qualitative evidence into insights a leadership team can act on. The POPLIFE activation’s 85% purchase intent figure, mentioned earlier, appears as a standalone brand metric separate from the financial layer.

Own The Guest Journey, Own Your Guest Data. Schedule A Demo.
Step 6: Report To Leadership In Three Layers
The three-layer reporting model gives festival ROI numbers a structure that survives internal scrutiny. Each layer answers a different leadership question.
- Financial ROI. Attributed revenue minus total activation cost, divided by total activation cost, with the attribution window stated explicitly alongside the number. Finance owns this layer.
- Behavioral Outcomes. Opt-in volume, data capture rate, lead-to-purchase rate, and cost per qualified lead. This layer shows operational efficiency and pipeline contribution.
- Brand Lift. Awareness, consideration, favorability, and NPS movement, each measured against the pre-event baseline and reported with a methodology note. This layer justifies the activation’s contribution to long-term brand equity.
Pre-commitment to this structure means circulating the objectives, KPIs, attribution window, and reporting format before the festival. When leadership sees the post-event report, the framework already feels familiar, and the team is simply filling in numbers against an accepted structure.
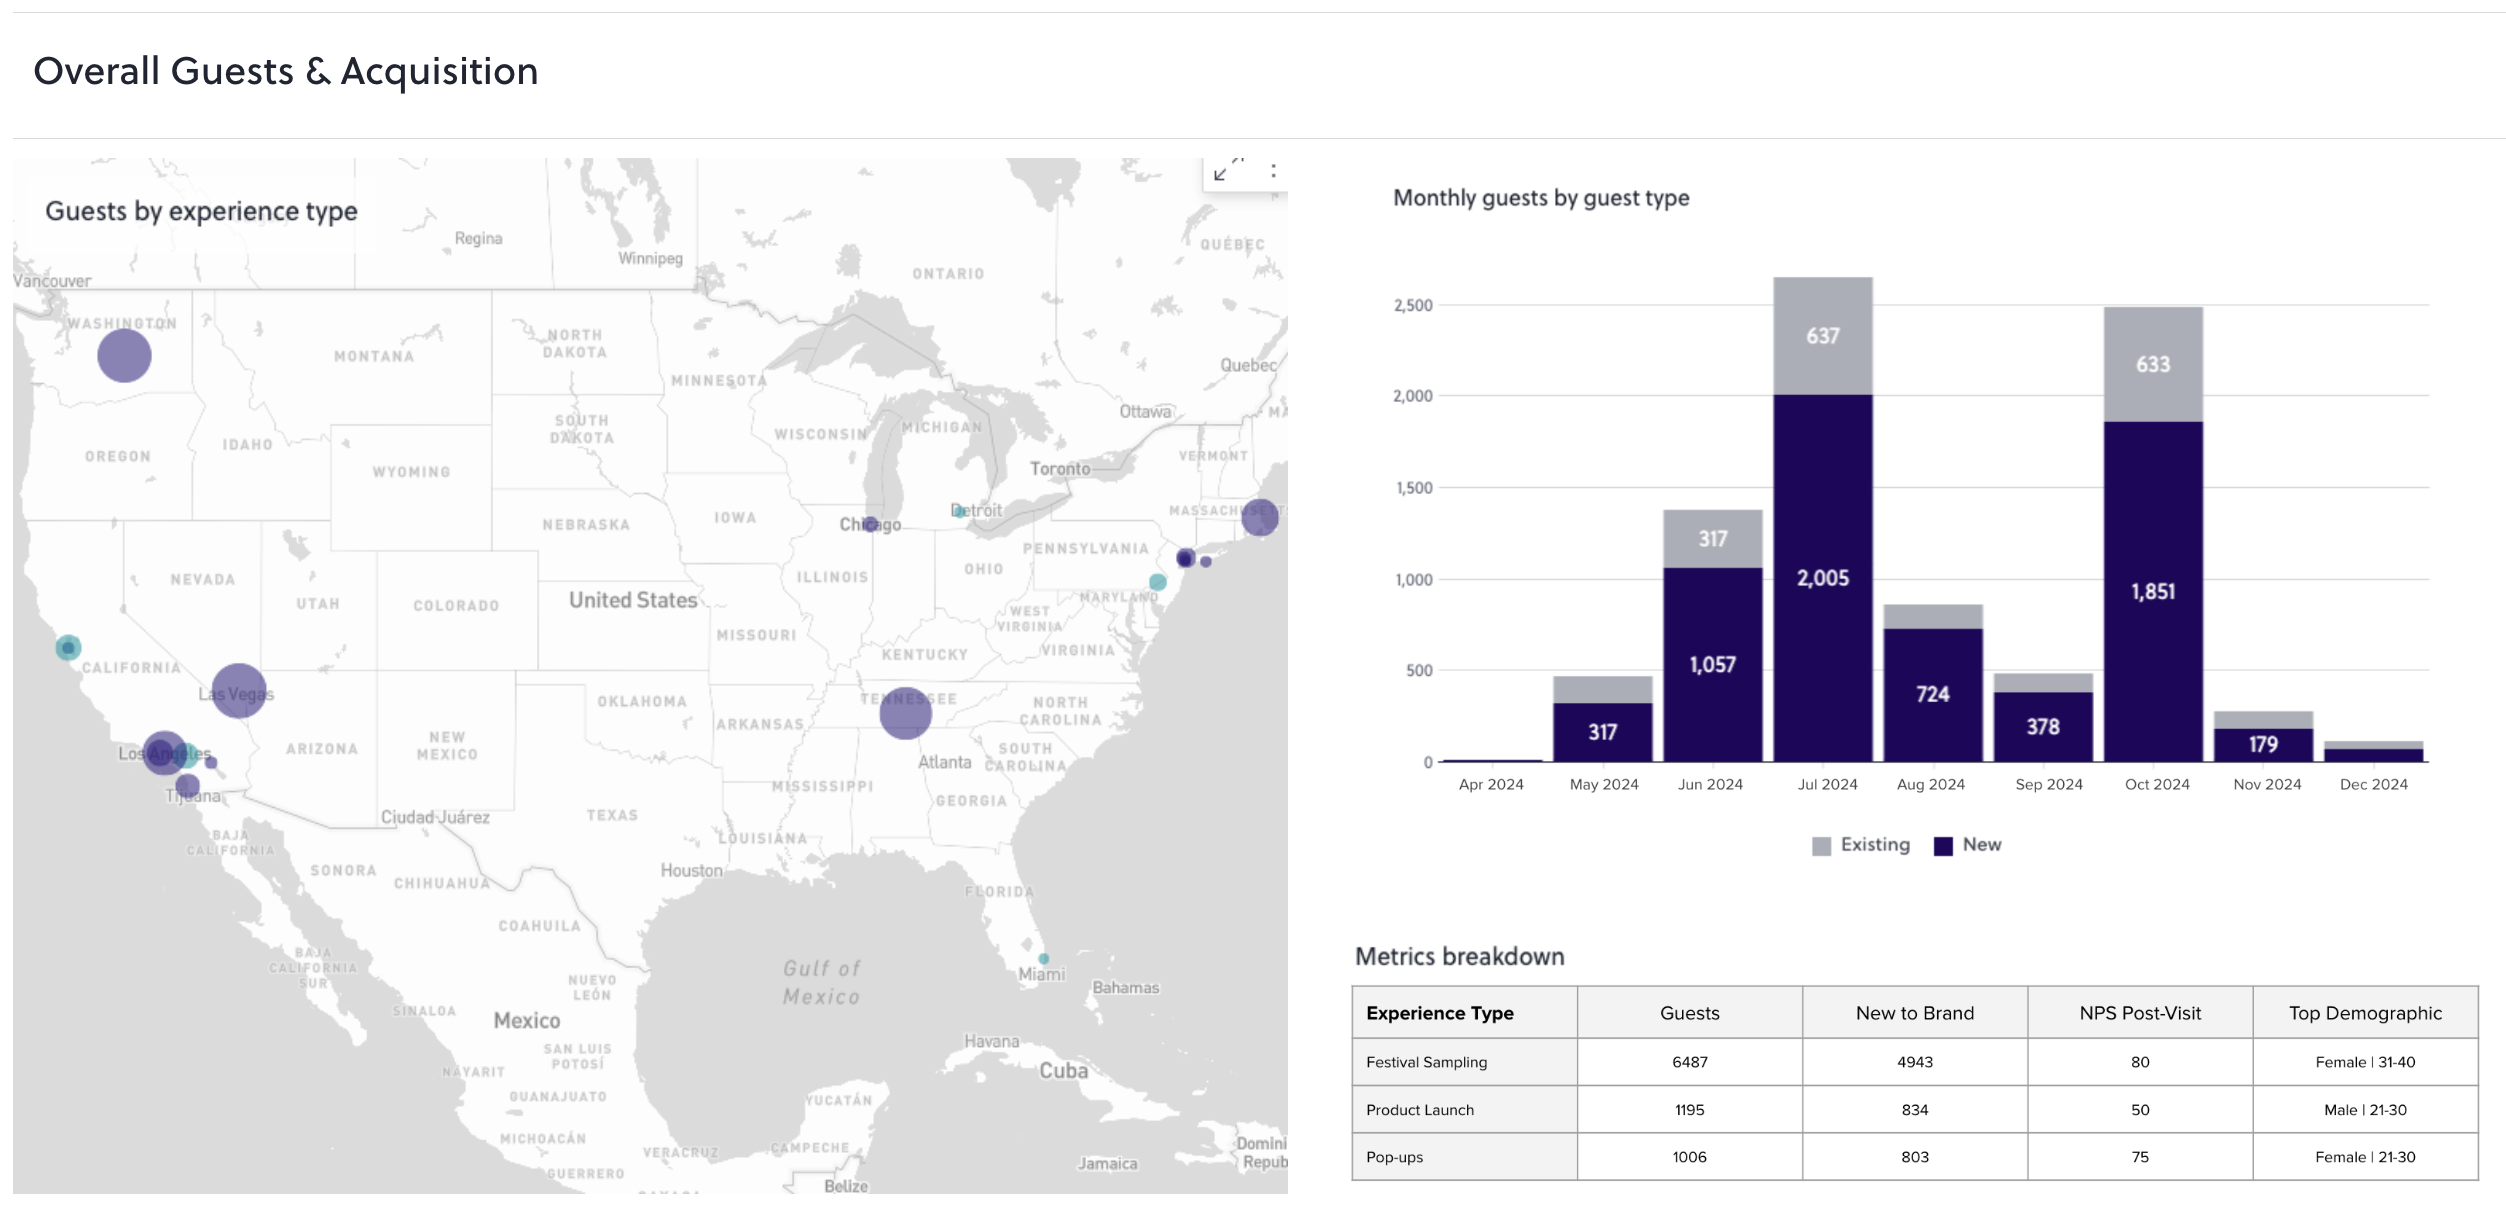
The dashboard should include attributed revenue, cost per qualified lead, opt-in volume, lead-to-purchase rate, and the brand-lift line. Every metric should carry its methodology note so the number is self-explanatory without a verbal defense.
Ready To 5X Your Marketing Opt-In Database? Schedule A Demo.
Common Measurement Mistakes And How To Fix Them
- No Attribution Window Defined Before The Event. Root cause: process gap. Fix: lock the window in the pre-event measurement plan and circulate it to finance and leadership before the festival.
- Calling All Post-Event Sales Incremental. Root cause: unclear methodology. Fix: apply pre and post surveys, exposed vs. unexposed cohorts, or holdout markets to estimate true incrementality.
- Blending Brand Lift Into The ROI Number. Root cause: unclear ownership. Fix: report financial ROI and brand lift as separate layers with separate methodology notes.
- Generic QR Codes And Promo Codes That Cannot Be Traced To A Specific Activation. Root cause: poor data inputs. Fix: create festival-specific QR codes and zone-level promo codes before leaving the office.
- Capturing Data Only From The Person Who Booked. Root cause: disconnected systems. Fix: use AnyRoad’s FullView feature to register every attendee in a group individually.
- Relying On A Depletion Report As The Measure Of Whether An On-Premise Activation Worked. Root cause: disconnected systems. Fix: deploy a receipt-based cashback rebate tied to an identifiable SKU, which is measurable without POS integration from the retailer.
- Reporting A Single Blended Number To Leadership With No Methodology Note. Root cause: unclear ownership. Fix: adopt the three-layer model and pre-commit to it before the festival.
How Do You Know The Measurement Plan Worked?
A measurement plan worked when four conditions are true. The team honored the attribution window that leadership agreed to before the festival. Every record in the CRM carries a festival source tag traceable to the activation. The financial and brand layers appear separately with methodology notes. Leadership accepts the number without re-litigating how it was produced.
Operational indicators also confirm correct execution. These include opt-in volume relative to interaction count, the ratio of opt-ins that converted to verified purchases within the window, and the time required to produce the post-event report. The POPLIFE team using AnyRoad generated detailed reports on event success in approximately 20 minutes, which shows that the data infrastructure was in place before the festival rather than assembled afterward.

Turn Tasting Room Visits Into Recurring Revenue. Schedule A Demo.
Next-Level Optimization: Extend The Plan Beyond The Festival
A festival activation that ends at teardown leaves most of its value on the table. The first-party records captured at the festival start a longer consumer relationship.
Post-event purchase conversion mechanics extend the activation’s commercial reach into the weeks following the festival. Cashback rebates, sweepstakes entries, and SMS follow-up sequences all play a role. AnyRoad’s platform connects festival-captured opt-ins to these mechanics and turns a QR scan at a sampling booth into a receipt-verified purchase at retail without retailer integration.
Segmenting the captured audience by NPS, spend, and visit frequency surfaces the consumers most likely to convert into recurring revenue. AnyRoad’s reporting shows that experience-driven opt-ins convert to paid loyalty at four times the rate of traditional channels, with member spending increasing 150% within the first year. A consumer who visits a brand experience twice is 512% more likely to convert into a paid loyalty enrollment, so the festival becomes the first step in an acquisition sequence.
The economics justify this focus. A single retail bottle purchase is worth roughly $100 to a brand. A club member who stays through six releases is worth roughly $600. The festival is where that relationship starts.
Conclusion: Make The Number Defensible Before The Festival Starts
A defensible festival ROI number comes from decisions made before the event. The team circulates and agrees on the measurement plan, locks the attribution window in writing, tags every asset before the activation launches, separates financial ROI from brand lift, and gains leadership buy-in on the three-layer reporting model before the festival opens.
Structured execution and clean first-party data make the number hold up. AnyRoad captures first-party data from every attendee, connects festival opt-ins to receipt-verified purchases without POS integration, and delivers AI-powered feedback analysis that turns open-text survey responses into actionable brand lift evidence. The measurement plan described here is executable on that platform today.
Put This Measurement Plan To Work. Schedule A Demo.