


Written by: Bryan Grobstein, Vice President, Global Revenue, AnyRoad
Key Takeaways From This Measurement Playbook
- Experiential marketing sales impact depends on a pre-event baseline, defensible attribution, and a sales-cycle-matched attribution window that separates causation from correlation.
- Receipt-verified purchase mechanics using QR registration, SMS cashback, and AI receipt validation deliver SKU-level conversion data without retailer POS integration.
- Incremental lift is calculated with difference-in-differences against matched control markets, then converted to ROI using incremental gross profit.
- A structured before-during-after measurement timeline (T-90 through T+90) supports clean data capture, real-time leading indicators, and final verified ROI reporting.
- AnyRoad provides end-to-end infrastructure that connects event engagement data to downstream purchases; see how AnyRoad connects event data to retail sales.
How To Measure Experiential Marketing's Impact On Sales
- Define the sales outcome and pull a pre-event baseline before the activation begins.
- Rank your attribution methods by defensibility and select the one appropriate to your channel.
- Set an attribution window that matches your actual sales cycle, then document the choice.
- Capture purchase proof without POS integration using receipt-verified mechanics.
- Calculate incremental lift against a matched control market using difference-in-differences.
- Convert that lift into an ROI figure using incremental gross profit.
- Run a structured before, during, and after measurement timeline from day one.
Step 1: Define The Sales Outcome And Set A Baseline Before The Event
Every measurement exercise starts with a number that exists before the activation touches anything. Without a pre-event baseline, any post-event sales change remains correlation instead of evidence. Pull the following data for each market you plan to activate, covering the prior 90 days at minimum:
- SKU-level unit sales by market and retail account
- Baseline conversion rate from trial or sampling to purchase (if available from prior programs)
- Average transaction value for the target SKU
- Existing customer file match rates from CRM or loyalty data
- Prior activation performance in comparable markets, including any depletion reports
These benchmarks must be locked before the activation launches. A rigorous retail activation measurement framework begins by gathering eight to twelve weeks of historical daily POS data for every candidate location so treatment and control stores can be matched on pre-period behavior. For high-frequency CPG categories, four to six weeks of pre-period data is the minimum. For premium or low-velocity spirits, eight to twelve weeks produces a more stable baseline.
The baseline anchors the attribution window decision in Step 3 and the control-market calculation in Step 5. Brands that skip this step cannot distinguish a sales lift from a seasonal trend, so the rest of the playbook never reaches full credibility.
Prove future retail sales impact from your experiences.
Step 2: Rank Your Attribution Methods By Defensibility
CFOs weigh attribution methods differently based on how directly they connect an activation to a purchase. The methods below appear in order from most to least defensible for experiential activations.
Unique Promo And QR Codes
A unique code or QR scan ties a specific purchase back to a specific activation touchpoint, producing a direct, auditable link between the event and the transaction. Unique attribution identifiers such as serialized digital coupons, dynamic QR codes, or retailer-specific barcodes can be used to track individual consumer redemptions when the brand does not own the point of sale. This method offers the highest defensibility for third-party retail and on-premise accounts.
CRM Lead Tagging
Every on-site registration carries an event source tag inside the CRM so downstream purchases inherit the activation label. This method becomes defensible when the CRM is clean, the tagging logic is consistent, and the attribution window is documented. It works best when the brand owns the transaction, such as direct-to-consumer, brand home retail, or e-commerce. It performs less well when purchases happen at third-party accounts where the transaction never enters the brand's system.
Control Market Vs. Test Market Sales Lift Analysis
Matched-market testing compares activation markets with comparable markets that did not receive the activation, using the control market as a counterfactual to estimate financial impact. This method isolates experiential marketing sales lift as causation instead of correlation and answers whether sales would have risen anyway. It requires matched markets with correlated historical sales profiles, identical baseline marketing activity, and a difference-in-differences calculation described in Step 5.
Experiential Marketing Measurement Vs. Last-Click Attribution
Last-click attribution credits the final digital touchpoint before purchase and systematically undercounts experiential marketing, which influences purchase intent earlier in the consumer journey. Position-based attribution, which allocates 40% of credit to first touch, 40% to lead creation, and splits the remaining 20% across intermediate interactions, better reflects the influence of initial discovery and final commitment than last-touch models. For activations, last-click serves as a weak supporting signal instead of a primary method because it consistently understates the channel's contribution.
Step 3: How To Set An Attribution Window For Experiential Marketing
The attribution window is the period during which a purchase can be credited to an activation touchpoint. A window that is too short excludes legitimate conversions. A window that is too long introduces noise from unrelated influences. The window must match the actual sales cycle of the product and market, and the choice must be documented before reporting begins so no one can adjust it after results are known.
Practical guidance by category:
- Retail And CPG (Spirits, Beer, RTD): 30–90 days. Most purchase decisions in these categories resolve within a month of trial, and a 90-day measurement window post-activation is recommended to capture repeat purchase behavior beyond the initial conversion spike.
- Premium Or Considered Purchases: Up to 180 days, particularly for high-ACV spirits where the consumer may visit a brand home, research further, and purchase weeks later.
- Enterprise Or Long B2B Cycles: 180–365 days. Typical B2B defaults are 90–180 days for enterprise and 180–365 days for the longest procurement cycles.
A practical selection rule is to measure the actual time-to-conversion distribution and set the window to cover the large majority of that lag, not the median, which excludes half of slower-converting consumers. A defensible rule of thumb is to anchor the window at the 75th to 90th percentile of the time-to-convert distribution. Once set, the window must remain fixed for the duration of the reporting period because changing it mid-campaign effectively changes the measurement system.
Step 4: How To Measure Experiential Marketing Without POS Integration
Ambassador tastings inside Total Wine, on-premise pours at a bar account, and field activations at a festival all share the same structural challenge. The brand does not own the transaction, cannot access the retailer's POS, and historically has had to rely on a depletion report that reveals nothing about who bought the bottle or why.
The receipt-verified purchase mechanic solves this while keeping retailers and bars out of the technical setup. The sequence works as follows:

- A brand ambassador uses AnyRoad Live to capture a QR registration on-site. The consumer scans, registers, and opts in.
- An SMS follow-up delivers a cashback rebate redeemable anywhere the product is sold.
- The consumer buys the bottle, photographs the receipt, and texts it back.
- AI reads the receipt, confirms the eligible SKU, and pays the rebate via Venmo or PayPal.
- The brand receives a first-party record tied to a receipt-verified purchase at SKU level.
Because the rebate is tied to a receipt rather than a retailer system, no POS integration is required from the retailer or bar. This design allows the mechanic to work across any account at scale. That structure makes a rebate tied to an identifiable SKU on a bar tab, such as a Fireball line item, measurable in a way a depletion report never achieves. Receipt validation lets brands verify purchases at any retailer without a data-sharing agreement or POS integration, and because every cashback payout is tied to a validated receipt, ROI measurement becomes a reporting exercise instead of a modeling exercise.
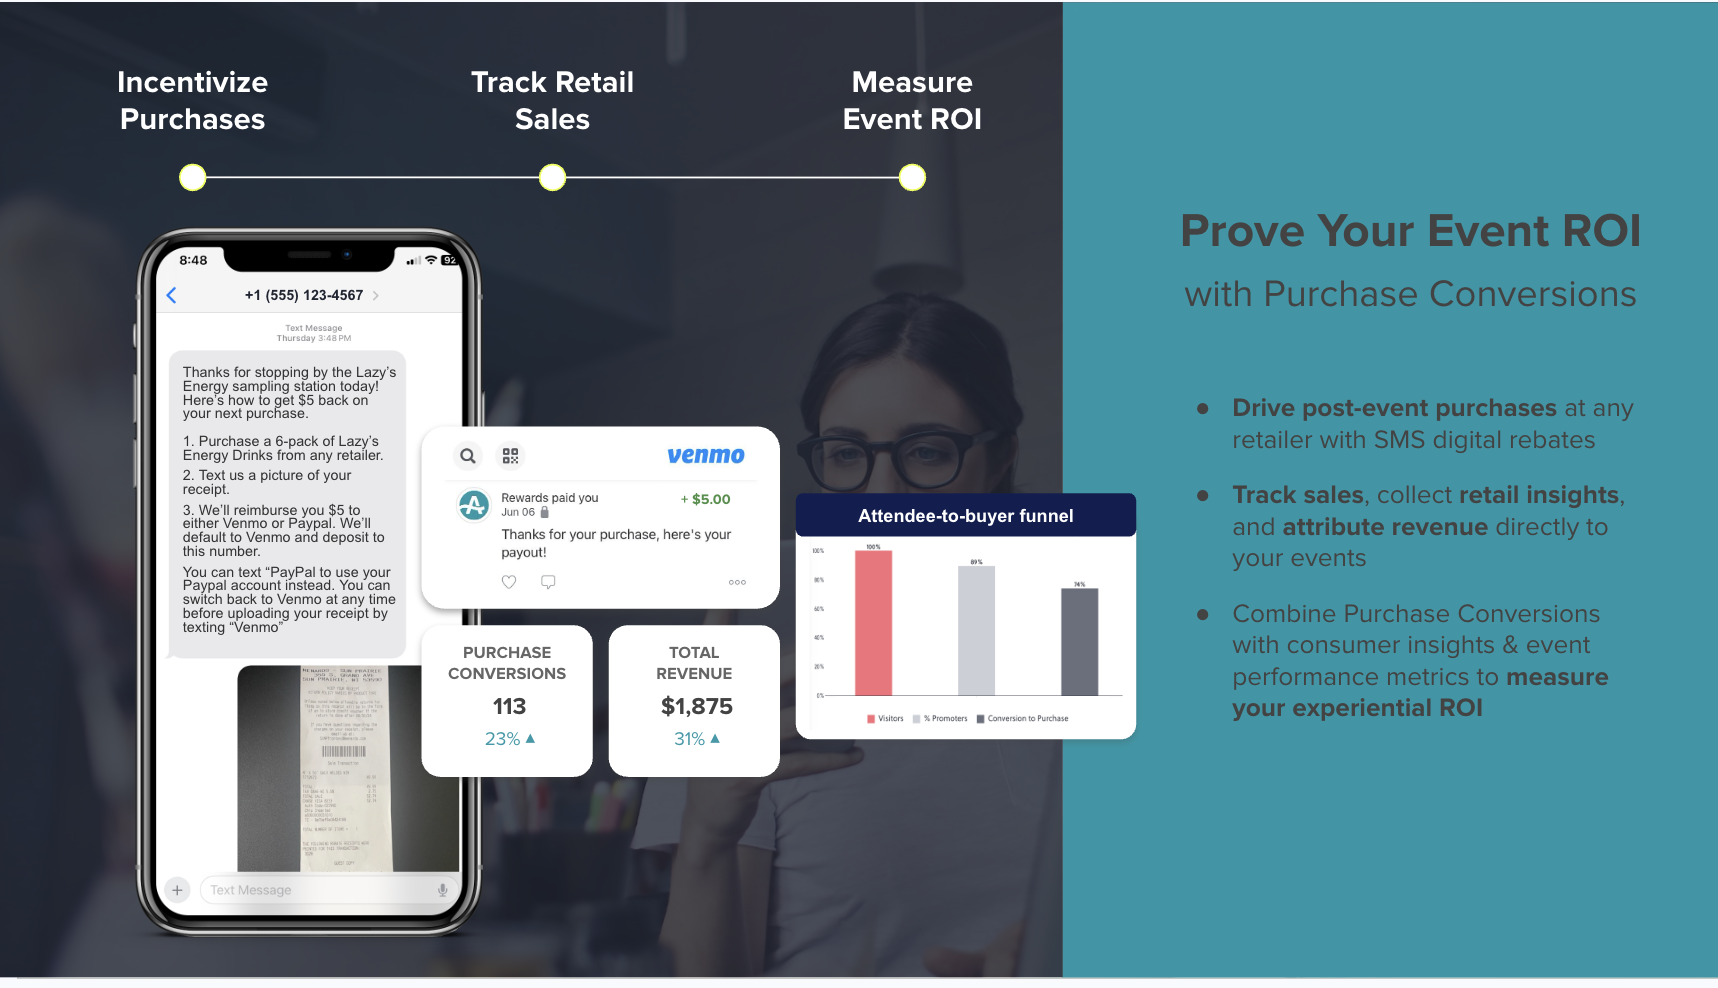
In a one-month ambassador tasting pilot with a single unnamed craft brand, 56% of the records collected converted to a bottle purchase. This was an early, small-sample pilot and should not be treated as a platform benchmark. It does, however, demonstrate that the mechanic produces a measurable conversion rate where depletion reports produced none.
A sweepstakes variant runs the same mechanic with a prize entry instead of cash back, such as Coachella tickets instead of a rebate. It carries identical data capture and SMS follow-up, and AnyRoad handles regulatory compliance including terms, conditions, and privacy policies.
For alcohol brands operating in regulated markets, the data capture must comply with applicable state and federal requirements. Under the Telephone Consumer Protection Act (TCPA), text marketing requires prior express written consent with clear disclosures about message frequency and standard carrier rates. Age verification must occur before any alcohol-related data capture. For alcohol sampling activations, verify birth dates locally on the device without storing full dates of birth in the marketing database.
See the receipt-verified mechanic in action.
Step 5: Calculating Experiential Marketing ROI With The Incremental Profit Formula
The goal is to isolate the sales that would not have happened without the activation so you can calculate true incremental profit. Two connected formulas handle the lift calculation and the return calculation.
Incremental Lift Formula (Difference-in-Differences):
Incremental Lift = (Test Market Post-Period Sales − Test Market Pre-Period Sales) − (Control Market Post-Period Sales − Control Market Pre-Period Sales)
ROI Formula:
ROI = (Incremental Gross Profit − Program Cost) / Program Cost
Using contribution margin as the basis for ROI keeps brands from declaring victory on high gross sales that actually lost money due to heavy product discounting or steep activation overhead.
Worked Control-Market Lift Example
The table below shows how difference-in-differences isolates the activation's true effect by stripping out organic market movement.
| Market | Pre-Period Weekly Units | Post-Period Weekly Units | Change |
|---|---|---|---|
| Test Market (activated) | 1,000 | 1,400 | +400 |
| Control Market (not activated) | 1,050 | 1,250 | +200 |
| Incremental Lift | — | — | 200 units/week |
Treatment stores rising from 1,000 to 1,400 weekly units against control stores rising from 1,050 to 1,250 units yields an accurate incremental estimate of 200 units. The 200-unit organic market movement in the control group is subtracted from the 400-unit gross gain in the test market.
Worked ROI Example
| Input | Value |
|---|---|
| Incremental units (4-week campaign, 10 stores) | 8,000 units |
| Net realized selling price per unit | $18.00 |
| Incremental revenue | $144,000 |
| Gross margin | 40% |
| Incremental gross profit | $57,600 |
| Total program cost | $30,000 |
| ROI | 92% (($57,600 − $30,000) / $30,000) |
Using total sales volume in the numerator of return calculations overstates performance and leads to misallocated trade marketing budgets, so incremental revenue must always be the foundation of return calculations.
Step 6: Run A Before, During, And After Measurement Timeline
The table below maps each phase of the measurement timeline to the actions required and the data captured so nothing falls through the cracks between baseline pull and final ROI report.
| Phase | Actions | Data Captured |
|---|---|---|
| Before (T−90 to T−1) | Pull 90-day SKU baseline; select and lock control markets; set attribution window; configure QR codes, CRM tagging, and SMS rebate flows; establish age-verification and consent workflows | Pre-period unit sales by SKU and market; baseline conversion rate; customer file match rates |
| During (Activation Window) | QR registrations via AnyRoad Live; opt-in capture from every attendee (FullView); dwell time and trial logging; purchase-intent survey; SMS rebate delivery | First-party registrations; opt-in rates; dwell time; trial counts; purchase intent scores; real-time receipt submissions |
| After (T+1 to T+90) | SMS follow-up sequences; receipt verification and SKU confirmation; attribution window tracking; control-vs-test lift calculation; ROI report | Receipt-verified purchase records; incremental unit lift; rebate redemption rate; repeat purchase rate; final ROI figure |
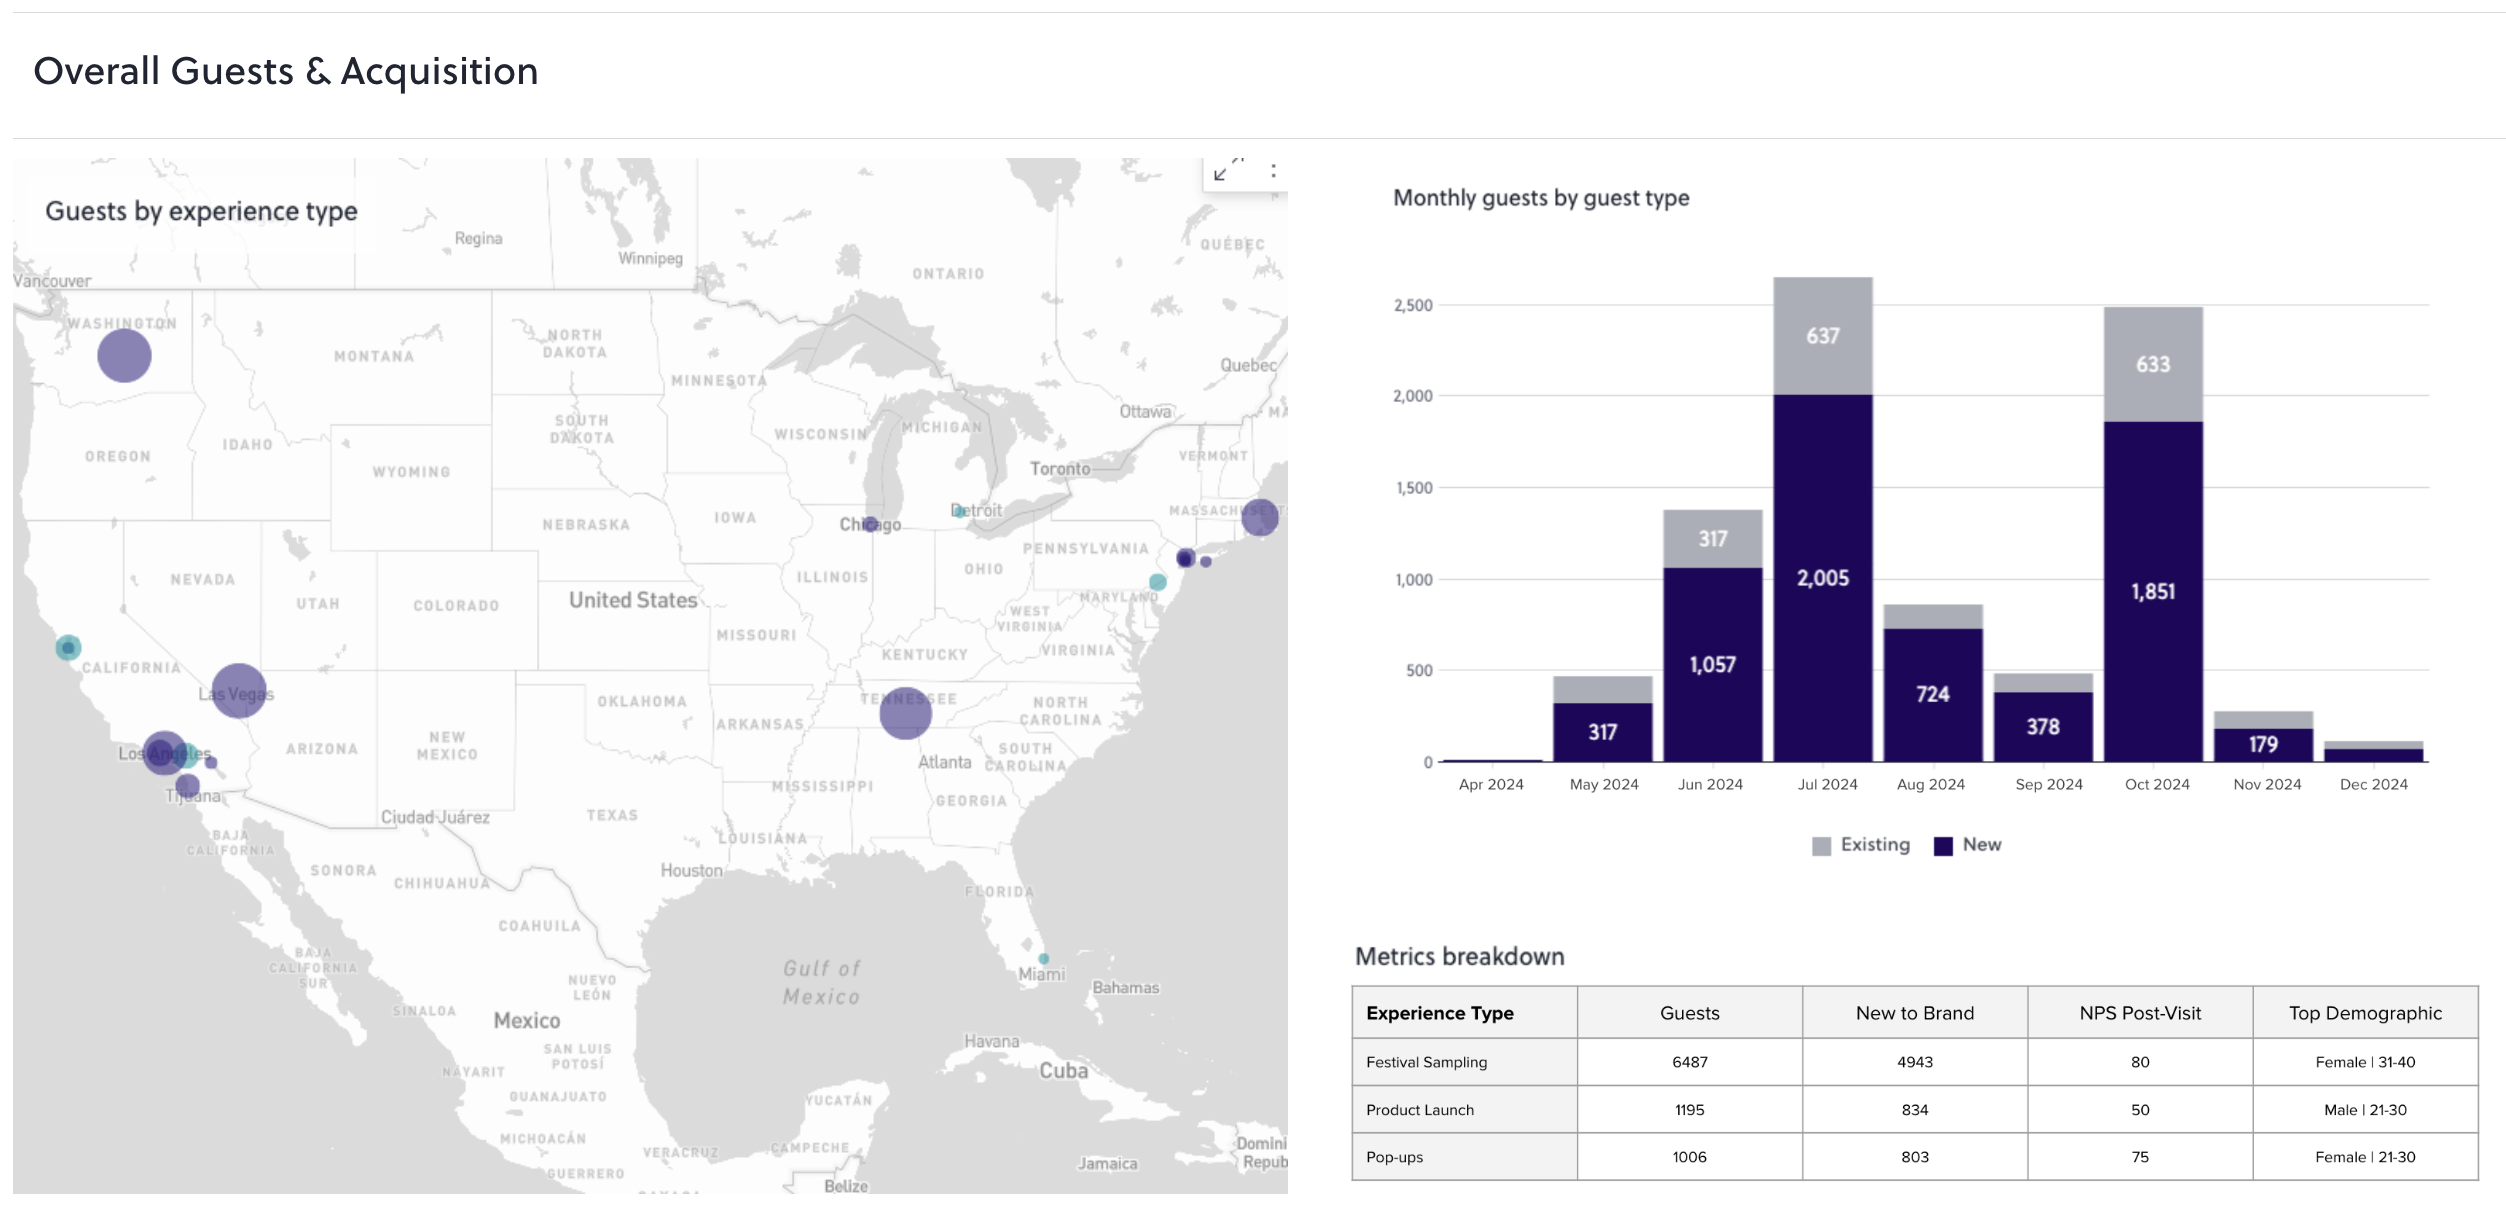
Establishing rolling 30-, 60-, and 90-day tracking windows in reporting dashboards monitors deal velocity and retail repeat purchases after an activation. The post-period is where the real commercial story develops, and the deepest gains in lifetime value from experiential marketing typically manifest between 6 to 12 months post-activation, characterized by higher repeat purchase rates and larger basket sizes.
Step 7: Balance Leading Indicators And Proof
Dwell time, product trials, and purchase intent act as leading indicators. They predict sales lift but do not prove it. A consumer who spends eight minutes at a tasting table and rates purchase intent at 9 out of 10 has not yet bought a bottle. These metrics provide valuable early signals while the sales lift analysis matures through the attribution window.
The data from AnyRoad's POPLIFE case study illustrates the gap. The POPLIFE festival activations resulted in 85% post-event purchase intent. Purchase intent at that scale signals strong potential, and it becomes proof only when receipt-verified purchase records confirm the conversion. Similarly, 74% of guests at CPG beauty brand field marketing events were more likely to purchase the brand's products after attending. That figure gains full defensibility when paired with verified redemption data.
Use leading indicators to brief stakeholders during the attribution window. Use receipt-verified lift and ROI calculations to close the report with proof.
All of these steps depend on reliable infrastructure that can capture, connect, and report data across the full timeline, which sets up the role of the platform layer.
Connecting Event Engagement Data To Downstream Purchases
The playbook above requires infrastructure that captures clean data before, during, and after an experience, connects it to purchase behavior, and produces a report a CFO can audit. AnyRoad is built to be that infrastructure.

AnyRoad's platform covers the full measurement stack:
- Configurable Data Capture: Custom questions before, during, and after an experience, embedded directly in the brand's website with full compliance and age-verification controls.
- FullView: Captures first-party data from every attendee in a group, not just the booker, closing the data gap that leaves brands missing contact information for the majority of their guests.
- Atlas Insights: Analytics dashboard measuring brand affinity, NPS, and purchase intent, filterable by experience, location, and demographic.
- PinPoint AI: Analyzes open-text survey responses at scale to surface themes, sentiment drivers, and actionable improvements in real time.
- Lifetime Loyalty — Cashback Rebates And Sweepstakes: The receipt-verified, SKU-level purchase conversion tools described in Step 4. These produce the first-party purchase records that connect experiential spend to retail sell-through without POS integration.
AnyRoad's data shows that a consumer who visits a distillery twice is 512% more likely to convert into a paid loyalty enrollment. Experience-driven opt-ins convert to paid loyalty at four times the rate of traditional channels, with member spending increasing 150% within the first year, according to AnyRoad's own reporting.

AnyRoad's Lifetime Loyalty platform launched publicly on February 20, 2025 and has been adopted by heritage distilleries including Heaven Hill Distillery, Nearest Green Distillery, and Lux Row Distillers, alongside craft brands such as Castle & Key, Catoctin Creek Distilling, and Tarnished Truth Distilling.
Frequently Asked Questions
How Long Should I Wait After An Activation Before Reporting Sales Impact?
As covered in Step 3, retail and CPG spirits typically use a 30-to-90-day window, while premium or low-velocity products may need up to 180 days. The window should be set before the activation launches, documented in the measurement plan, and held fixed through reporting. Changing the window after results are visible creates a credibility risk in any CFO review. Leading indicators like purchase intent and trial counts can be reported immediately, while the incremental lift calculation should wait until the attribution window closes.
Who Should Own Experiential Measurement — Field Marketing, Brand, Or Insights?
Measurement works best when it is a shared responsibility with a single owner for the final number. Field marketing owns on-site data capture and operational execution. Brand owns the baseline pull, the attribution window decision, and the control-market design. Insights or analytics owns the lift calculation and the ROI report. The common failure mode occurs when field marketing reports attendance and impressions while insights waits for POS data that never arrives in a usable form. Aligning on the measurement methodology, including the formula, the window, and the control market, before the activation launches prevents that disconnect.
Do I Need Retailer POS Integration To Measure An Ambassador Tasting?
No. As explained in Step 4, the receipt-verified rebate mechanic requires nothing from the retailer or bar. The consumer registers via QR code, receives an SMS cashback offer, buys the bottle, and texts back a receipt for AI validation. The brand receives a first-party purchase record tied to the activation. This mechanic works at third-party retail accounts, on-premise bars, and festival activations, and AnyRoad handles the mechanic end to end, including compliance for sweepstakes variants.
What If I Cannot Build A Matched Control Market?
When a true matched control market is unavailable, several alternatives preserve some measurement rigor. A time-series baseline model compares activation-period sales against a projected baseline derived from pre-period trends, adjusted for seasonality. A pre/post analysis within the same market is weaker than a control-market design but remains more defensible than no baseline at all. Receipt-verified purchase data from the rebate mechanic provides a direct conversion count that does not require a control market because it simply counts how many registered consumers bought the product. For brands with access to retailer loyalty data, a buyer-level comparison between exposed and unexposed consumers in the same market can approximate a control group. Document whichever method you use and label the result clearly in the report.
How Do I Keep Receipt-Verified Rebate Programs Compliant In A Regulated Category?
For alcohol brands in the United States, the primary compliance considerations are tied house rules, TCPA consent for SMS, state-level sweepstakes regulations, and age verification. Under TTB tied house rules, promotional mechanics should point consumers to a "where to buy" page or multiple retailers rather than a single named account. SMS rebate delivery requires prior express written consent with clear disclosures about message frequency. Sweepstakes require official rules and a free no-purchase-necessary Alternative Method of Entry (AMOE) with equal odds, and registration and bonding are required in New York and Florida for prizes over $5,000, while Rhode Island requires registration only for retail promotions with prizes over $500 (no bond). Age verification must occur before any data capture at an alcohol activation. AnyRoad manages the regulatory compliance layer for its cashback rebate and sweepstakes mechanics, including terms, conditions, and privacy policies, so brands do not have to build that infrastructure internally.
Conclusion: Structured Execution, Clean Data, Measurable Outcomes
Experiential marketing's impact on sales becomes measurable when the measurement infrastructure is in place before the activation begins. The playbook has seven steps: pull a pre-event baseline, rank attribution methods by defensibility, set a sales-cycle-matched window, capture receipt-verified purchase proof without POS integration, calculate incremental lift against a control market, convert that lift into an ROI figure built on gross profit, and run a structured before-during-after timeline from day one.
The hard case, which includes activations at third-party retail, on-premise accounts, and ambassador tastings where the brand does not own the transaction, is now measurable. Receipt-verified, SKU-level purchase data closes the loop between an activation and a bottle leaving a shelf, producing a number that survives a CFO audit without requiring a single retailer to open its POS system.
Structured execution and clean data produce measurable outcomes. The brands that will defend their experiential budgets next quarter are the ones building that infrastructure today.
Build your experiential measurement infrastructure with AnyRoad.