


Written by: Bryan Grobstein, Vice President, Global Revenue, AnyRoad
Key Takeaways for Event ROI
- 40% of event organizers still struggle to prove ROI because they lack a structured measurement methodology, not because of insufficient effort.
- Four prerequisites must be in place before any ROI calculation can be accurate: clear objectives, historical baselines, tracking infrastructure, and a 0–180 day reporting window.
- The seven-step framework separates incremental revenue from baseline sales by using control groups, receipt-verified purchases, and difference-in-differences analysis.
- Brand-lift metrics such as NPS and purchase-intent deltas are measured alongside revenue outcomes, with final results reported at the 180-day mark.
- See how AnyRoad automates first-party data capture and 0–180 day ROI reporting.
Prerequisites for Accurate Event ROI Measurement
Accurate event ROI starts with four concrete inputs that you set up before the event runs.
- Clear objectives: Each event must have a stated primary goal, such as revenue, brand lift, loyalty enrollment, or purchase intent, defined before the event date.
- Historical baseline data: Sales velocity, NPS, branded search volume, and retention rates from the 8–12 weeks prior to the event establish the counterfactual.
- Tracking infrastructure: First-party data capture at registration, on-site survey tools, CRM integration, and receipt-verified purchase mechanics must be operational before the event runs.
- A defined 0–180 day reporting window: Organizations should set a 90–180 day measurement window, reporting preliminary results at 30 days, interim pipeline results at 90 days, and final revenue-attributed results at 180 days.
Without these inputs, ROI calculations rest on assumptions rather than evidence. Many corporate event budgets lack a dedicated measurement capture line item, which means the tracking infrastructure described above is never deployed, making retroactive ROI calculation impossible once the event has already occurred.
See how AnyRoad's platform captures the first-party data this framework requires.

Step 1: Define Event Objectives and Map Them to Metrics
Objective: Translate business goals into measurable outcomes before any spend is committed.
Preparation: Align with brand leadership on the single primary objective for each event. Rank any secondary objectives.
Action: Use the mapping table below to assign at least one leading indicator and one lagging indicator per objective.
Checkpoint: Document objectives and mapped metrics, then share them with the analytics team before the event date.
| Event Objective | Leading Indicator | Lagging Indicator | Measurement Tool |
|---|---|---|---|
| Drive incremental purchase | On-site purchase intent score | Receipt-verified retail conversion | Post-event survey + cashback rebate |
| Build brand affinity | Post-visit NPS | Branded search volume lift | On-site survey + Google Trends |
| Grow loyalty enrollment | On-site club enrollment rate | Member retention at 6 releases | CRM enrollment data |
| Expand first-party database | Data capture rate per attendee | Marketing opt-in conversion | Registration platform analytics |
Event KPIs differ from raw metrics because they are tied to specific objectives that indicate whether the event created value, not simply whether people attended.
Step 2: Establish Pre-Event Baselines
Objective: Create a defensible counterfactual that shows what would have happened without the event.
Preparation: Pull 8–12 weeks of historical data on each mapped metric. Identify a comparable geography or customer segment that will not receive the activation to serve as a control group.
Action: Record baseline values and lock the control group before the event runs. Without a pre-event baseline there is no way to quantify the size of any post-event change in behavior, perception, or brand description.
Checkpoint: Store baseline data in a shared dashboard accessible to both marketing and finance.
| Metric | Treatment Market (Pre-Event) | Control Market (Pre-Event) | Target Post-Event Delta |
|---|---|---|---|
| Weekly retail velocity (units) | Recorded value | Recorded value | +15% incremental lift |
| Brand NPS | Recorded score | Recorded score | +10 points |
| Branded search volume | Recorded index | Recorded index | +8-week delta vs. control |
| Loyalty enrollment rate | Recorded % | Recorded % | +5 percentage points |
Step 3: Capture On-Site and Post-Event Data
Objective: Collect complete, individual-level data from every attendee, not just the booking contact.
Preparation: Configure registration and check-in tools to capture custom fields such as purchase intent, product familiarity, demographic data, and marketing opt-in consent. Set post-event surveys to send within 24 hours of the experience.
Action: Use QR-code registration at field activations to capture data from walk-in attendees. At brand homes, capture data from every member of a group, not only the lead booker. Proximo Spirits found they were missing contact information for over 66% of guests before implementing group-level data capture, after which they collected 69% more guest data and 34% more NPS responses.

Checkpoint: Review the data completeness rate, meaning the percentage of attendees with a full profile, within 48 hours of each event. Fast post-event follow-up often improves pipeline outcomes.
Step 4: Calculate Direct and Incremental Revenue
Objective: Separate revenue that would have occurred anyway from revenue caused by the event.
Preparation: Assemble fully loaded event costs, including venue, staffing, A/V, travel, swag, agency fees, and internal opportunity cost. Costs must be fully loaded to include venue, catering, A/V, speaker fees, staff time, swag, and opportunity cost for the ROI formula to be defensible.
Action: Apply the standard formula, Event ROI = ((Returns − Costs) / Costs) × 100, using only incremental returns, not total attributed revenue. Incremental revenue equals total post-event revenue from the treatment group minus the revenue the control group generated over the same period. For retail activations, use receipt-verified purchase data tied to individual attendee records to connect the activation to a specific bottle sold.
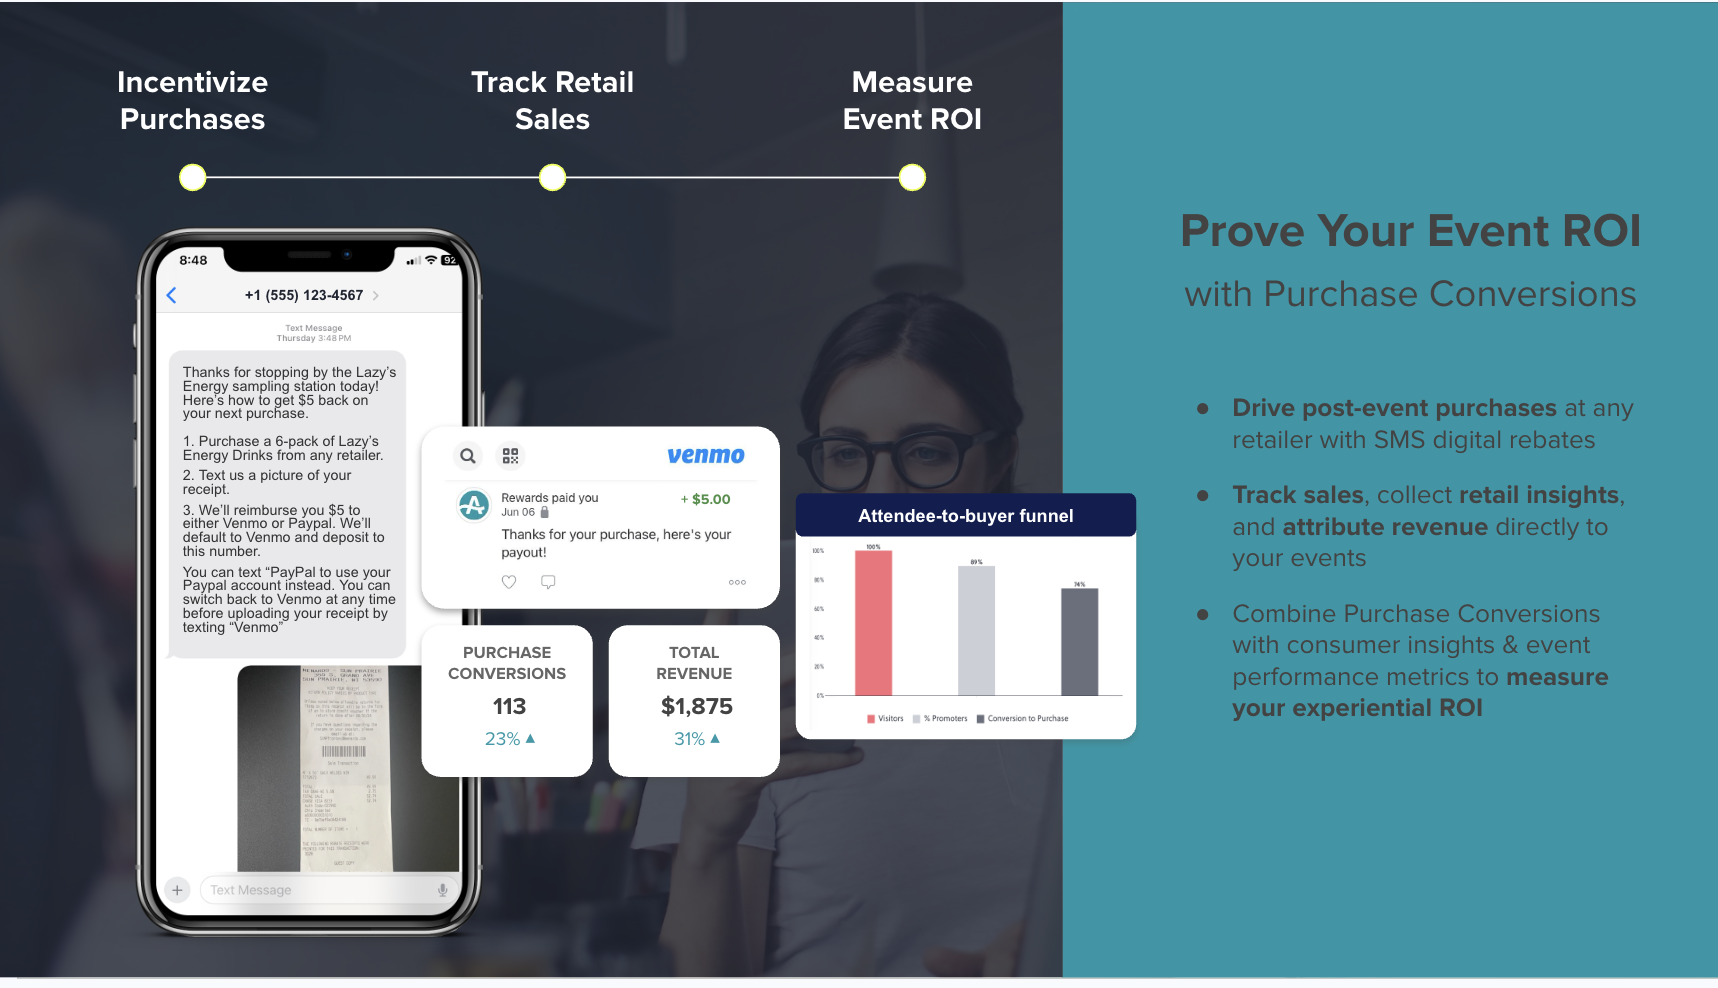
Checkpoint: Apply a 90–180 day attribution window before finalizing revenue figures. B2B and brand events should use a minimum 90-day attribution window, with 180 days for longer consideration cycles, to capture event-sourced and event-influenced pipeline before calculating final ROI. Interim revenue figures at 30 days are directional only. However, revenue alone does not capture the full value of brand events, because many outcomes that drive future purchases first appear as shifts in perception and behavior, which is why the next step focuses on brand-lift measurement.
Step 5: Measure Brand-Lift and Behavioral Outcomes
Objective: Quantify changes in perception and behavior that precede and predict future revenue.
Preparation: Design a pre/post survey with three or fewer neutral questions targeting the primary brand-lift metric. Marketers should define a single primary objective and select one to three aligned lift metrics rather than measuring everything.
Action: Administer the survey to both the treatment group, meaning event attendees, and the matched control group. Calculate absolute lift as the percentage-point difference between groups on each metric.
Checkpoint: Report results only when the lift exceeds the study's confidence interval. A reported lift is only meaningful if it exceeds the study's confidence interval, typically reported at 90% or 95% confidence.
| KPI Category | Metric | Measurement Method | Reporting Window |
|---|---|---|---|
| Financial | Incremental revenue | Control-group difference-in-differences | 90–180 days |
| Financial | Revenue per attendee | Total incremental revenue ÷ attendees | 180 days |
| Brand lift | NPS delta | Pre/post survey vs. control | 0–30 days |
| Brand lift | Purchase intent lift | Exposed vs. control survey | 0–30 days |
| Behavioral | Branded search volume | Geo-filtered Google Trends delta | 8 weeks post-event |
| Behavioral | Retail conversion rate | Receipt-verified purchase data | 30–90 days |
| Loyalty | Enrollment rate | CRM enrollment records | 0–30 days |
| Loyalty | Member retention at release 6 | Club churn tracking | 180+ days |
Real-world benchmarks confirm that these metrics move meaningfully. Using AnyRoad analytics, Diageo measured a 16-point NPS increase from pre-visit to post-visit at Johnnie Walker Princes Street, and centralized analytics from AnyRoad showed that Campari Group visitors converted to brand promoters after their experiences.
Step 6: Run Incrementality Tests
Objective: Establish statistical causation between the event and measured outcomes, not just correlation.
Preparation: Construct a matched control group before the event. Match on baseline sales velocity, geography, customer demographics, and visit frequency. For alcohol and CPG brands with loyalty programs, segment by visit history, because a consumer who has visited twice is 512% more likely to convert to a paid loyalty enrollment than a first-time visitor, which makes visit frequency a critical matching variable.
Action: Apply a difference-in-differences calculation. Pipeline incrementality is measured as τ = (Y_T,post − Y_T,pre) − (Y_C,post − Y_C,pre), where Y is the outcome metric, such as revenue, enrollment, or NPS, over matched 90-day pre- and post-event windows. For geo-based activations, include a sufficient number of markets per group to detect a meaningful lift with statistical confidence.
Checkpoint: Report iROAS, meaning incremental revenue divided by event spend, alongside platform-attributed ROAS. Platform ROAS includes non-incremental revenue that would have occurred anyway, and an example shows platform ROAS of 5.0 dropping to iROAS of 3.0 when only 60% of attributed revenue is truly incremental.
For alcohol brands using cashback rebate mechanics at third-party retail accounts, receipt-verified purchase data ties each activation directly to a bottle sold, which replaces the depletion report with individual-level conversion evidence that survives an incrementality audit.
Step 7: Build and Report the Executive Dashboard
Objective: Deliver a single, defensible view of event ROI that finance and brand leadership can act on.
Preparation: Integrate event data with CRM, retail sell-through data, and loyalty platform records so the dashboard populates automatically through system connections rather than manual export.
Action: Structure the dashboard around four reporting lanes: financial returns, brand lift, behavioral outcomes, and loyalty impact. Show the baseline, the post-event result, and the incremental delta for every figure.
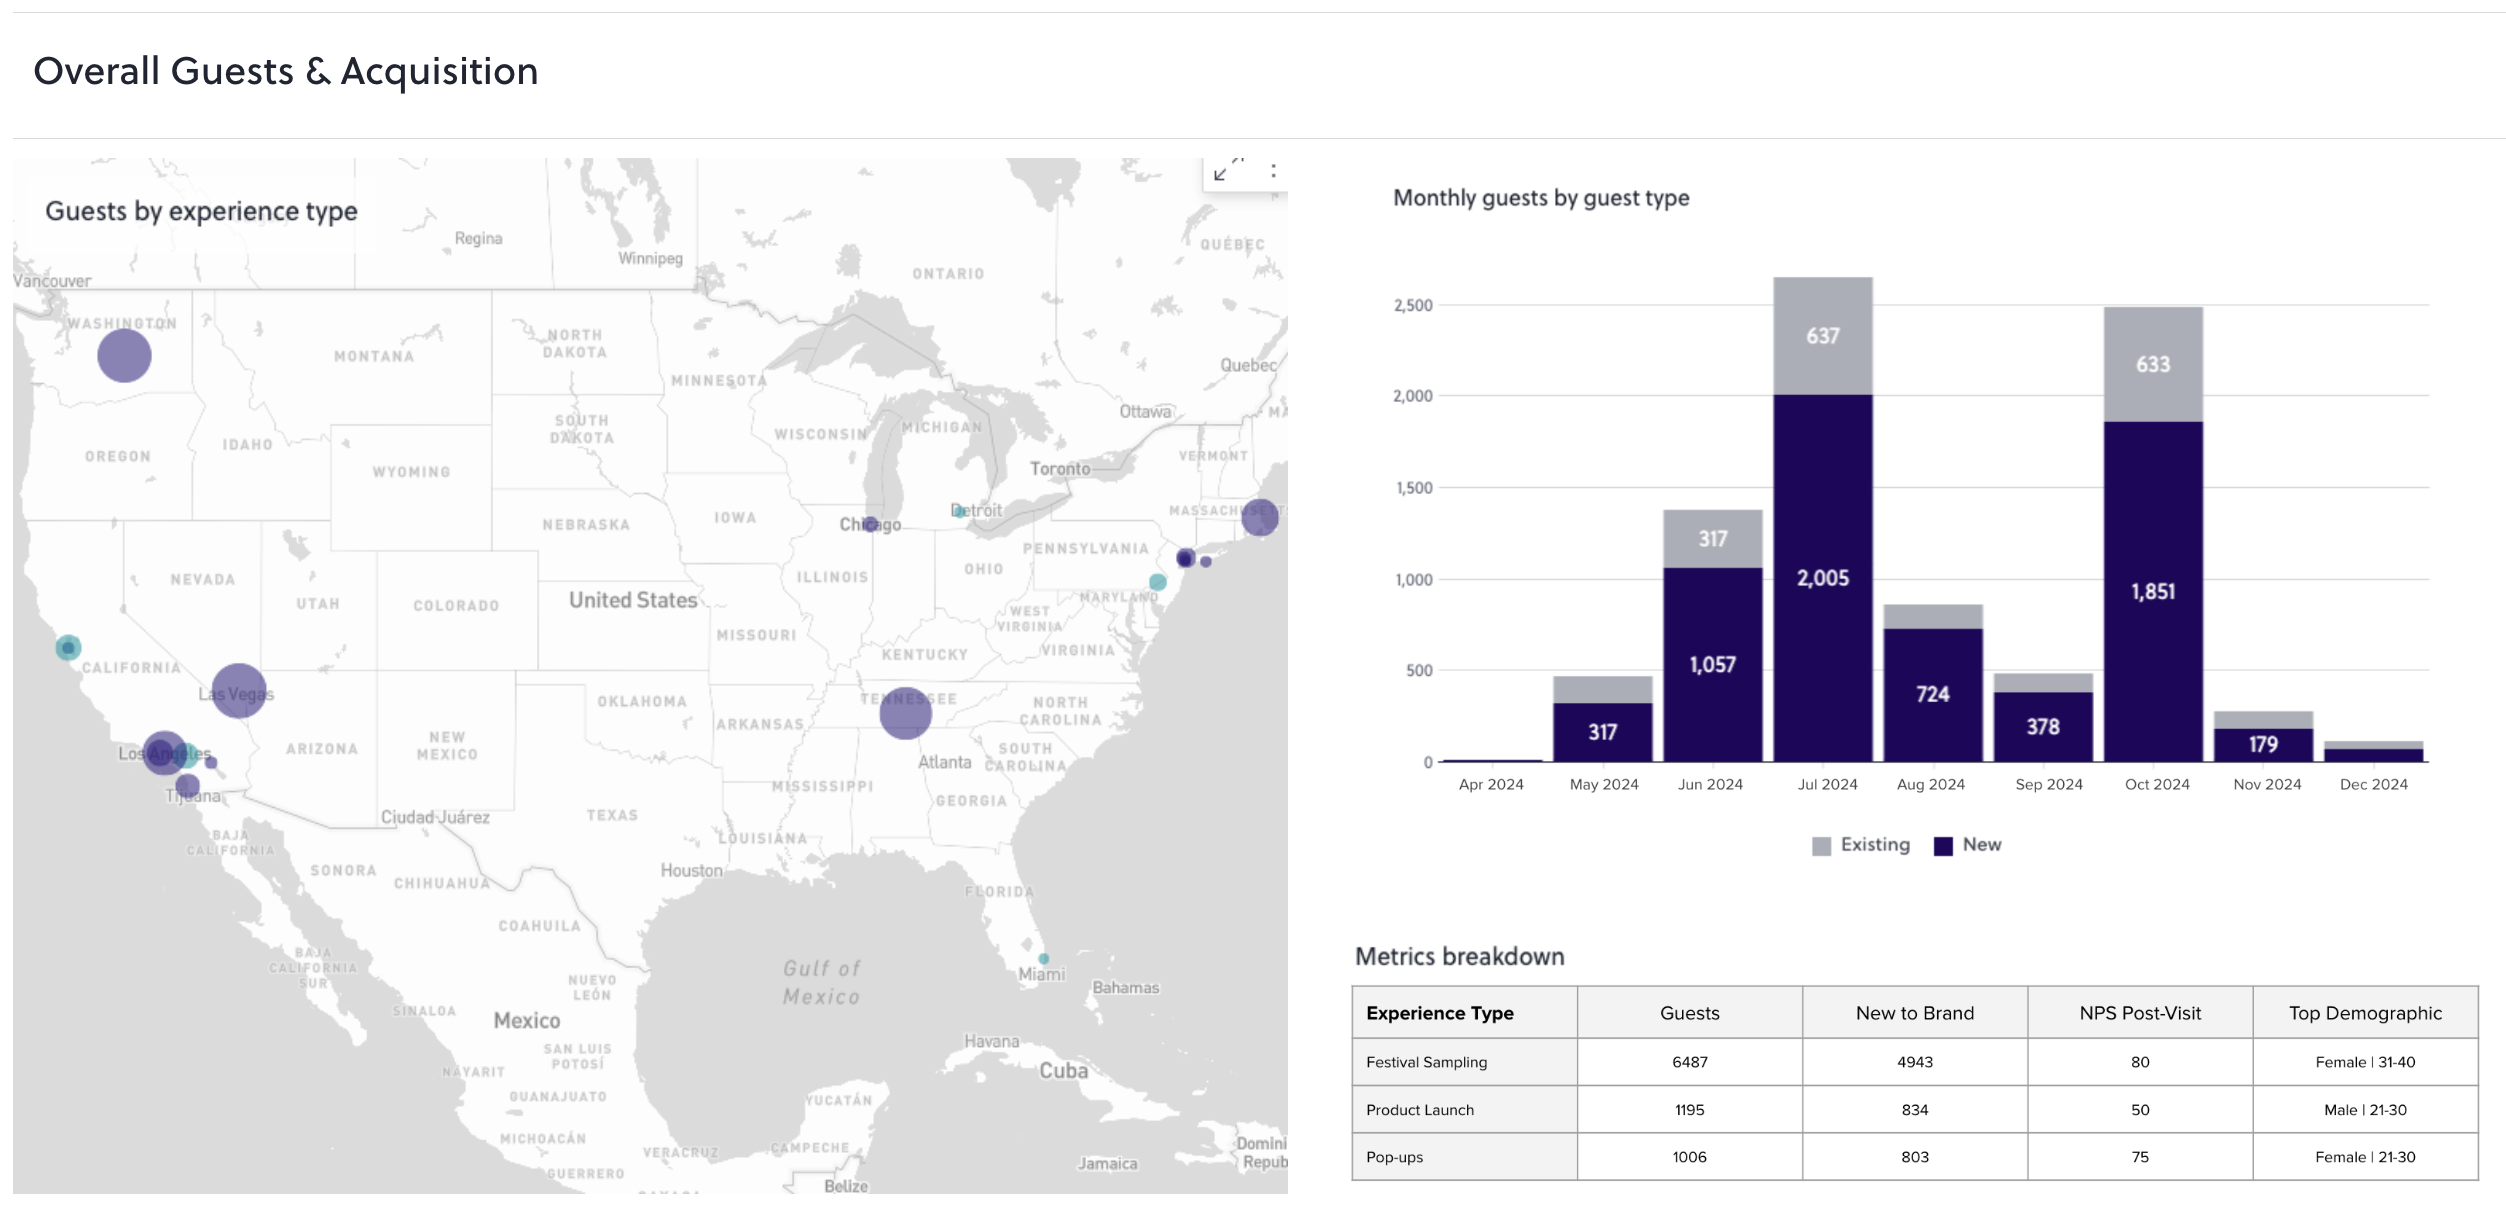
Checkpoint: Review the dashboard at 30, 90, and 180 days with the same stakeholder group that approved the event budget.
| Dashboard Lane | Metric | Baseline | Post-Event Result |
|---|---|---|---|
| Financial | Incremental revenue (180-day) | Control group revenue | Treatment group revenue − control |
| Financial | Event ROI % | Control not applicable | ((Incremental returns − costs) / costs) × 100 |
| Brand lift | NPS delta | Pre-event NPS | Post-event NPS − control NPS |
| Brand lift | Purchase intent lift | Control group intent % | Exposed group intent % − control % |
| Behavioral | Retail conversion rate | Pre-event velocity | Receipt-verified post-event rate |
| Loyalty | Enrollment rate | Pre-event enrollment % | On-site enrollment % at event |
Measurement Cadence: 0–180 Day Reporting Schedule
A single post-event report misses most of the value an event generates, so you need a staged reporting cadence.

- Day 0–7 (Immediate): Attendance, data capture rate, on-site NPS, purchase intent scores, and enrollment counts. These are operational metrics, not final ROI figures.
- Day 30 (Preliminary): Post-event survey results vs. control group, branded search volume delta, marketing opt-in conversion, and early retail velocity data. Preliminary results at 30 days are directional indicators, not final revenue attribution.
- Day 90 (Interim): Difference-in-differences revenue estimate, receipt-verified purchase conversion rate, pipeline value from event-sourced leads, and loyalty enrollment retention. Many repeat event decisions occur within 6 months, which makes the 90-day read critical for budget renewal conversations.
- Day 180 (Final): Full incremental revenue calculation, final iROAS, brand-lift study results with confidence intervals, loyalty member retention rate, and customer lifetime value delta. This is the figure presented to leadership as the definitive event ROI.
Explore how AnyRoad's Atlas Insights dashboard automates this reporting cadence.
Benchmarks: Interpreting ROI Percentages for Brand Events
ROI benchmarks for brand events vary by event type, sales cycle length, and how you define returns.
- 200%–400%: A working range for B2B field events after pipeline conversion.
- 300%–500%: A realistic target for most experiential and field-marketing events is 300% to 500% ROI, with top-performing programs at mature companies reaching 600% or more.
- 3:1–10:1: Early-stage product launches and brand-awareness events often achieve measurable ROI in the 3:1 to 10:1 range, with the remainder justified through brand-lift studies rather than hard revenue.
For alcohol and CPG brands specifically, purchase intent benchmarks from field activations are strong. Festival activations for an artisanal mezcal brand produced an 85% post-event purchase intent rate. A CPG beauty brand's field events showed 74% of guests were more likely to purchase after attending. These figures represent leading indicators, and final ROI depends on converting intent into verified purchase within the 90–180 day window.
The key distinction for experiential marketing is that brand-lift value, such as NPS improvement, awareness lift, and consideration increase, represents real economic value even when it does not appear in a 30-day revenue report. Brand events typically show effects with a 6-month to multi-year time lag, which requires separate tracking of leading indicators such as brand awareness and NPS alongside lagging indicators such as sales and retention.
Advanced Tips for Alcohol and CPG Brands
Alcohol brands face measurement challenges that general event ROI frameworks do not address, including three-tier distribution, compliance limits on direct transactions, and tasting room visits that act as both brand moments and acquisition channels.
Several practices help close these gaps and connect experiences to revenue.
- Use receipt-verified purchase mechanics at third-party retail: Cashback rebates tied to specific SKUs, redeemable anywhere the product is sold, produce individual-level conversion data without requiring POS integration at the retail account. This approach replaces the depletion report with a direct line from activation to bottle sold.
- Treat the second visit as the conversion signal: AnyRoad's data shows that a consumer who visits a distillery twice is 512% more likely to convert to a paid loyalty enrollment. Tracking visit frequency in the CRM and flagging second-visit guests for enrollment outreach creates a direct revenue lift.
- Anchor the lifetime value calculation: A single retail bottle purchase is worth approximately $100 to a brand. A club member who stays through six releases is worth approximately $600. The ROI of any activation that converts a visitor to a member should reflect this difference, not just the on-site transaction value.
- Use white-glove staff coaching for on-site enrollment: On-site enrollment during a distillery visit is the highest-converting channel for loyalty programs. Coached tour guides and retail managers who make the enrollment pitch at the right moment, typically paired with a same-day discount, outperform any digital follow-up sequence. AnyRoad's spirits industry experts work directly with on-site staff to structure this enrollment experience and handle the operational lift that brands would otherwise staff internally.
- Segment by NPS and visit frequency before reporting: Absolut Home's data revealed that smaller guest groups generate higher revenue per guest and satisfaction, a finding that only surfaces when complete guest-level data, as described in Step 3, is segmented rather than reported in aggregate. The same segmentation logic applies to identifying which attendee profiles convert to members, repeat purchasers, or brand promoters.
Frequently Asked Questions
What is incrementality testing and why does it matter for brand events?
Incrementality testing measures the revenue or behavioral change caused specifically by an event, as opposed to outcomes that would have occurred without it. It requires a matched control group, meaning a comparable set of consumers or markets that did not receive the activation, and compares their outcomes to the group that did. Without incrementality testing, event ROI calculations include baseline revenue that would have happened regardless of the event, which overstates the event's actual contribution. For alcohol and CPG brands, incrementality testing is particularly important because seasonal sales patterns and distribution changes can mimic event-driven lifts if not controlled for.
Why is a 90–180 day attribution window necessary for brand events?
Most brand events influence purchase decisions that occur weeks or months after the experience, not at the point of contact. A consumer who visits a distillery, tries a product, and receives a follow-up offer may not purchase at retail for 30–60 days. A loyalty member enrolled on-site generates recurring revenue across multiple release cycles. Measuring ROI at 30 days captures only the fastest-moving conversions and systematically undercounts the event's total contribution, which is why the attribution windows described in Step 4 are necessary to capture the full revenue impact.
What is a good ROI percentage for experiential marketing events?
For field activations and brand home experiences at alcohol and CPG companies, a target range of 300%–500% ROI is realistic for programs with defined objectives, baseline data, and a 90–180 day measurement window. Pure brand-awareness events with no direct purchase mechanic often produce 0%–150% in measurable financial ROI, with the remaining value captured in brand-lift metrics such as NPS improvement, purchase intent lift, and branded search volume growth. These brand-lift outcomes have real economic value because they reduce future customer acquisition costs and increase conversion rates on subsequent marketing, although they require a longer time horizon to appear in revenue figures.
How do control groups work in event ROI measurement?
A control group is a set of consumers, accounts, or geographic markets that are comparable to the event audience but do not receive the activation. Before the event, both groups are measured on the same baseline metrics, such as sales velocity, NPS, purchase intent, or loyalty enrollment rate. After the event, the difference between the two groups' outcomes represents the incremental effect of the event. Matching should be done on variables most predictive of the outcome, and for alcohol brands these typically include visit frequency, baseline purchase rate, geography, and demographic profile. The control group must be locked before the event runs, because retroactive control group selection introduces selection bias.
How do loyalty metrics connect to event ROI for alcohol brands?
Loyalty metrics are the most durable financial outcome of brand events for alcohol companies. A tasting room visit that converts to a bottle club enrollment moves a consumer from a single transaction worth approximately $100 to a recurring relationship worth approximately $600 across six releases. Tracking enrollment rate, retention through the six-release churn inflection point, and member spend growth within the first year produces a loyalty-adjusted ROI figure that reflects the true long-term value of the event. Churn in bottle clubs concentrates around the six-release mark and is typically driven by product depletion, because members who have not finished their current allocation do not want more, which means retention programming focused on consumption, such as cocktail classes with master distillers, acts as a direct ROI lever.
Conclusion: Turn Event Spend into a Defensible Growth Engine
Measuring the ROI of brand events starts as a pre-event infrastructure decision, not a post-event spreadsheet exercise. Brands that define objectives before spending, establish baselines against a matched control group, capture individual-level data on-site, apply a 90–180 day attribution window, and run incrementality tests produce ROI figures that survive budget reviews and justify future investment. Brands that skip these steps produce attendance reports.
The seven steps in this framework are repeatable across event types, geographies, and budget sizes. The inputs change, but the methodology does not. Applied consistently across a portfolio of activations, brand homes, and field events, this framework turns experiential spend from a line item that requires defense into a revenue driver with a documented return.