


Written by: Bryan Grobstein, Vice President, Global Revenue, AnyRoad
Key Takeaways
- Calculate tasting room ROI by dividing net profit, including attributed downstream club and online revenue, by the complete cost of operations, then multiplying by 100.
- Include all five cost categories in the denominator: staff wages and pour cost, reservation and ticketing software, marketing allocation, facility overhead per square foot, and opportunity cost of the space.
- Track revenue per visitor by visitor type, data capture rate, purchase conversion rate, and club conversion rate as core operating metrics.
- Use a three-step attribution path, with data capture at the visit, email match to ecommerce, and club enrollment as the bridge, to connect visits to later revenue and report both an attributed floor and modeled range.
- Use AnyRoad to capture first-party data from every attendee, connect visits to club enrollment and later purchases, and access white-glove expertise so the measurement model runs consistently.
See How AnyRoad Connects Visits To Revenue.
Before You Begin
Before you can measure ROI from tasting room visits, you need six inputs: visitor counts, POS or ecommerce data, reservation software access, staff cost data, facility overhead figures, and the ability to match a visit record to a later purchase or club enrollment. The tasting room manager, DTC lead, or marketing lead owns the model, while operations supplies the cost inputs. Because those inputs change monthly, the model refreshes monthly and the team reviews it with leadership quarterly.
This playbook focuses on a measurement model rather than a metric glossary. AnyRoad's existing How To Prove Tasting Room ROI article covers metric definitions, and this playbook goes deeper on attribution mechanics and cost completeness. Some portion of visits will remain unattributable, and the model acknowledges that reality directly. The revenue being measured often lands weeks or months after the visit, so this process applies after the visit as much as during it.
How To Calculate Tasting Room ROI
Gather staff cost data, software invoices, marketing spend, facility square footage, and rent or mortgage figures before building the formula. The standalone tasting room ROI formula is:
Tasting Room ROI = (Sales − Costs) ÷ Costs × 100, where Costs include all costs associated with the program, such as wine poured, staffing, and any lost revenue, as illustrated by WineGlass Marketing's tasting room example ($8,000 − $6,000 = $2,000 ÷ $6,000 = 30%).
Net Profit = Total Revenue − (Total COGS + Staffing + Overhead), where Total Revenue includes on-site tasting room revenue and attributed downstream revenue.
Total tasting room cost of operations = staffing (wages) + cost of goods sold / pour cost for wine poured + overhead (rent or mortgage, utilities, insurance) + marketing.
An understated denominator is the most common reason a tasting room looks unprofitable or artificially profitable when downstream revenue is excluded from the numerator. The formula above corrects both errors by pairing a complete cost base with a complete revenue picture.
Tasting Room Cost Of Operations Breakdown
Operators most frequently omit reservation and ticketing software, marketing allocation, facility overhead per square foot, and the opportunity cost of the space. Square footage is the defensible allocation key for rent and common area maintenance. If the tasting room occupies 2,000 of 10,000 square feet, it carries 20% of occupancy costs. Utilities can be allocated via a hybrid of square footage and volume or by metered consumption, while administrative overhead and marketing are allocated by revenue percentage.
The operational rule is to choose one allocation method, document it, and apply it consistently so trend analysis remains meaningful. A CFO reviewing this model should be able to see each assumption and change it live. That transparency is what makes the number defensible.
With the denominator settled, the next step is to decide what revenue to measure against those costs and how to track it per visitor.
Revenue Per Visitor In The Tasting Room
Revenue per visitor is the core operating metric for tasting room performance. Segment visitor data by new versus returning, reservation versus walk-in, and event versus standard tasting before calculating it. A flagship Napa Valley tasting room averaging $42 per visitor in gross sales compares unfavorably to a 1,200-square-foot secondary urban tasting room generating $69 per visitor. That gap reflects staffing ratios, real estate costs, and pricing power rather than wine quality.
Traffic alone does not indicate profitability. A tasting room with falling foot traffic but rising revenue per visitor is healthier than one with rising traffic and flat per-visitor spend. Reservation data tracking 363 wineries through early 2026 shows a consistent average year-over-year decline in tasting room visitation of roughly 2%. Per-visitor revenue now determines tasting room channel health.
Tasting Room Data Capture Rate
Data capture rate is the percentage of visitors who provide a contactable record. It acts as the leading indicator of future revenue because a visit that produces no contactable record cannot be attributed later. Commerce7's 2026 Data Drop analysis found that 53.7% of POS transactions are processed without a customer profile attached, rising to nearly 60% on Saturdays. Data capture is most likely to be skipped precisely when visitor volume is highest.
The gap is often structural because only the booker's information gets captured. AnyRoad's FullView capability captures data from every attendee in a group, not just the booker. Before implementing FullView, Proximo Spirits was missing contact information for over 66% of its guests. After implementation, the brand immediately began collecting 69% more guest data and 34% more NPS responses. To find your own gap, audit how many transactions are processed without a customer profile attached, then calculate data capture rate as the share of visitors who provide a contactable record. That rate becomes the denominator for every attribution calculation that follows.

Increase Your Tasting Room Data Capture.
Attributing Tasting Room Visits To Online Sales
The identity-resolution path runs in three steps: data capture at the visit, email match to ecommerce, and club enrollment as the bridge. A winery's customer record can capture what a person buys, how often they purchase, and whether they belong to the club. It can also track tasting room purchases, booked experiences, promotion responses, and last engagement date. None of this works unless those systems share a common identifier.
When data capture is built into a required step such as an age check at a distillery or visitor center, a brand can learn where visitors traveled from, follow up after a visit, and connect the dots to later online purchases. Some portion of visits will remain unattributable regardless of the mechanism. Report an attributed floor, which is the revenue you can directly connect to named visitors, and a modeled range that accounts for the unattributable share, instead of treating unattributable revenue as zero.
The table below shows why partial measurement fails. Only a full cost taxonomy combined with attribution produces a defensible ROI number, because every other approach either omits costs or misses downstream revenue.
| Measurement Approach | Cost Completeness | Attribution Capability | Downstream Revenue Capture |
|---|---|---|---|
| Staff and pour cost only | Omits software, marketing, facility overhead, space opportunity cost | None | None |
| Full cost taxonomy without attribution | Complete | None | None |
| Full cost taxonomy with attribution | Complete | Email match to ecommerce, club enrollment bridge | Attributed floor and modeled range |
Wine Club Conversion Rate Benchmark
Attribution shows what a visit is worth after the fact, and club conversion shows whether the visit produces the recurring revenue that makes that value grow. Wine Industry Sales Education (WISE) identifies wine club conversion rate as a core tasting room KPI, recommending measurement on a per-host basis alongside sales per host and average order value. WISE puts the benchmark for wine club conversion at roughly 6% for a seated tasting experience. Below that threshold, their data suggests the club is not being meaningfully presented to guests.
The more useful comparison is a brand's own history rather than an industry average. WISE mystery shopping data found that the share of tastings where staff effectively presented the wine club fell to 13% in Q1 2026, down from a 2025 average of 35%. Calculate conversion against convertible guests only, excluding trade visitors and existing club members, measured off the POS. Track whether hosts raise the club before the guest asks, whether guests ask about the club unprompted, and whether the club comes up before the last pour. Those behaviors act as leading indicators, and the conversion rate becomes the lagging result.
Tasting Room Lifetime Value
Silicon Valley Bank's 2026 Direct-to-Consumer Wine Report found the lifetime value of an individual wine club member reached $2,803 in 2025, the highest figure in the report's 15-year history. AnyRoad's own data anchors the math at a more granular level: a consumer who visits a distillery twice is 512% more likely to convert into a paid loyalty enrollment. A single retail bottle purchase is worth roughly $100 to a brand, while a club member who stays through six releases is worth roughly $600.
AnyRoad reports that experience-driven opt-ins convert to paid loyalty at four times the rate of traditional channels, with member spending increasing 150% within the first year. Expressed as an acquisition-cost reframe, the tasting room visit functions as a customer acquisition event with a calculable cost and a payback period measured in club releases rather than quarters.

The Monthly Tasting Room ROI Dashboard
Build a simple monthly dashboard that tracks the fields that matter most:
- Visitor count
- Revenue per visitor by segment (new vs. returning, reservation vs. walk-in, event vs. standard tasting)
- Data capture rate
- Purchase conversion rate
- Club conversion rate (against convertible guests only)
- Attributed downstream revenue
- Total cost of operations (using the full taxonomy)
- Tasting room ROI
Roll these fields up monthly and review the full model with leadership quarterly. The model's credibility depends on being able to show a CFO the assumptions and change them live. Every field must trace to a named source or a stated assumption the reviewer can adjust.
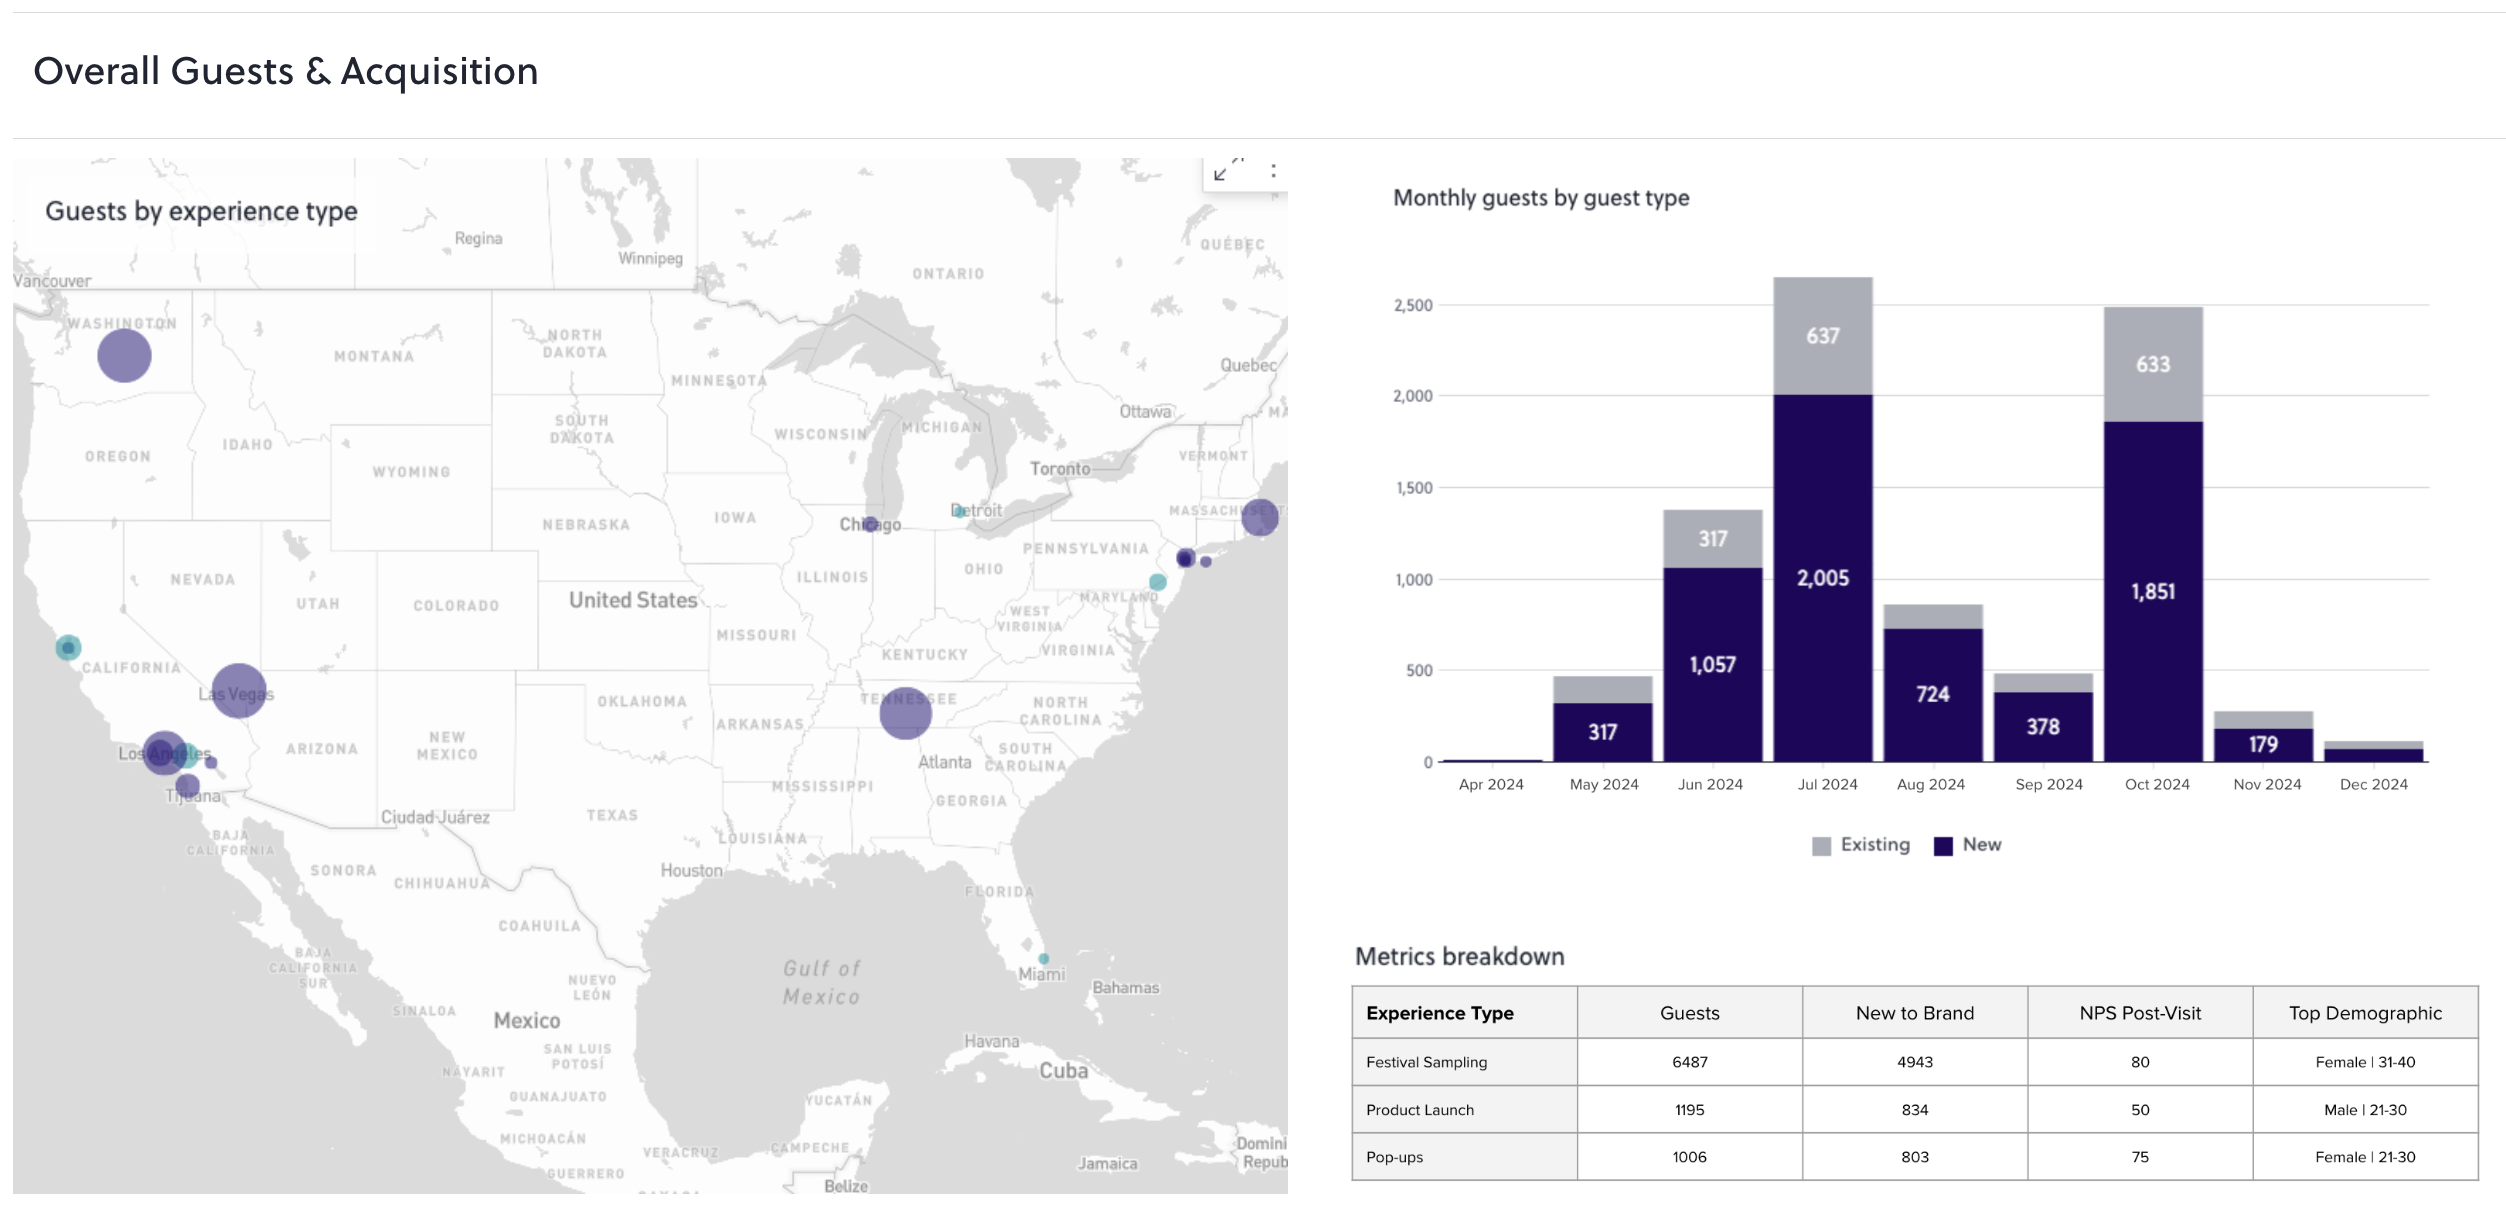
Get Your Tasting Room ROI Model Running.
Operational Considerations For Reliable Data
Execution depends on who captures data at the door, how staff are coached to ask for it, and how reservation and walk-in records are reconciled into the same system. Staff must record club enrollment at the point of pitch rather than reconstructing it later. Age verification and ID scanning at check-in, marketing opt-in language, and compliant data capture in a regulated alcohol environment act as non-negotiable prerequisites. AnyRoad's integrated ID scanning embeds age verification directly into check-in, so compliance becomes part of the guest flow instead of a separate step.
Consistency across locations, teams, and event types allows the model to produce comparable numbers month over month. The handoff between the tasting room team and the DTC or club team is where attribution most often breaks down. Both sides must use the same identifiers for the email match to work.
Common Mistakes And Troubleshooting
- Understated denominator: Staff and pour cost only, with software, marketing allocation, facility overhead, and space opportunity cost omitted. Use the full taxonomy from the cost breakdown section.
- No contactable record: Only the booker's information is captured, so group members cannot be attributed. Capture data from every attendee using AnyRoad's FullView.
- Measuring the visit as a standalone P&L: The visit looks unprofitable because its downstream revenue is booked elsewhere. Apply the acquisition-cost reframe and include attributed downstream revenue in the numerator.
- Treating unattributable revenue as zero: The model understates return. Report an attributed floor and a modeled range.
- Inconsistent identifiers: Email at booking does not match email at purchase. Standardize the identifier and reconcile monthly.
Measuring Success Of Your ROI Model
The model is working when data capture rate trends upward, attribution coverage improves month over month, revenue per visitor is segmented and stable, and club conversion is tracked against the brand's own history rather than a generic benchmark. Reporting time should also decrease. WISE frames this directly: measure it to manage it. The model's credibility with a CFO depends entirely on the ability to show assumptions and change them live. A number nobody can interrogate becomes a number nobody will act on.
Advanced Tips For Extending Attribution
Once the core model runs cleanly, several refinements extend its reach. Automate the email match between reservation and ecommerce systems to eliminate manual reconciliation. Segment high-value cohorts by NPS, spend, and visit frequency using AnyRoad's Atlas Insights to surface the guests most likely to enroll in a club or upgrade their tier. Connect cross-channel follow-up to the 39-day window. Among guests whose first tasting room purchase was in 2025, those who eventually became repeat buyers made their second purchase at a median of just 39 days. Most wineries miss that window entirely.

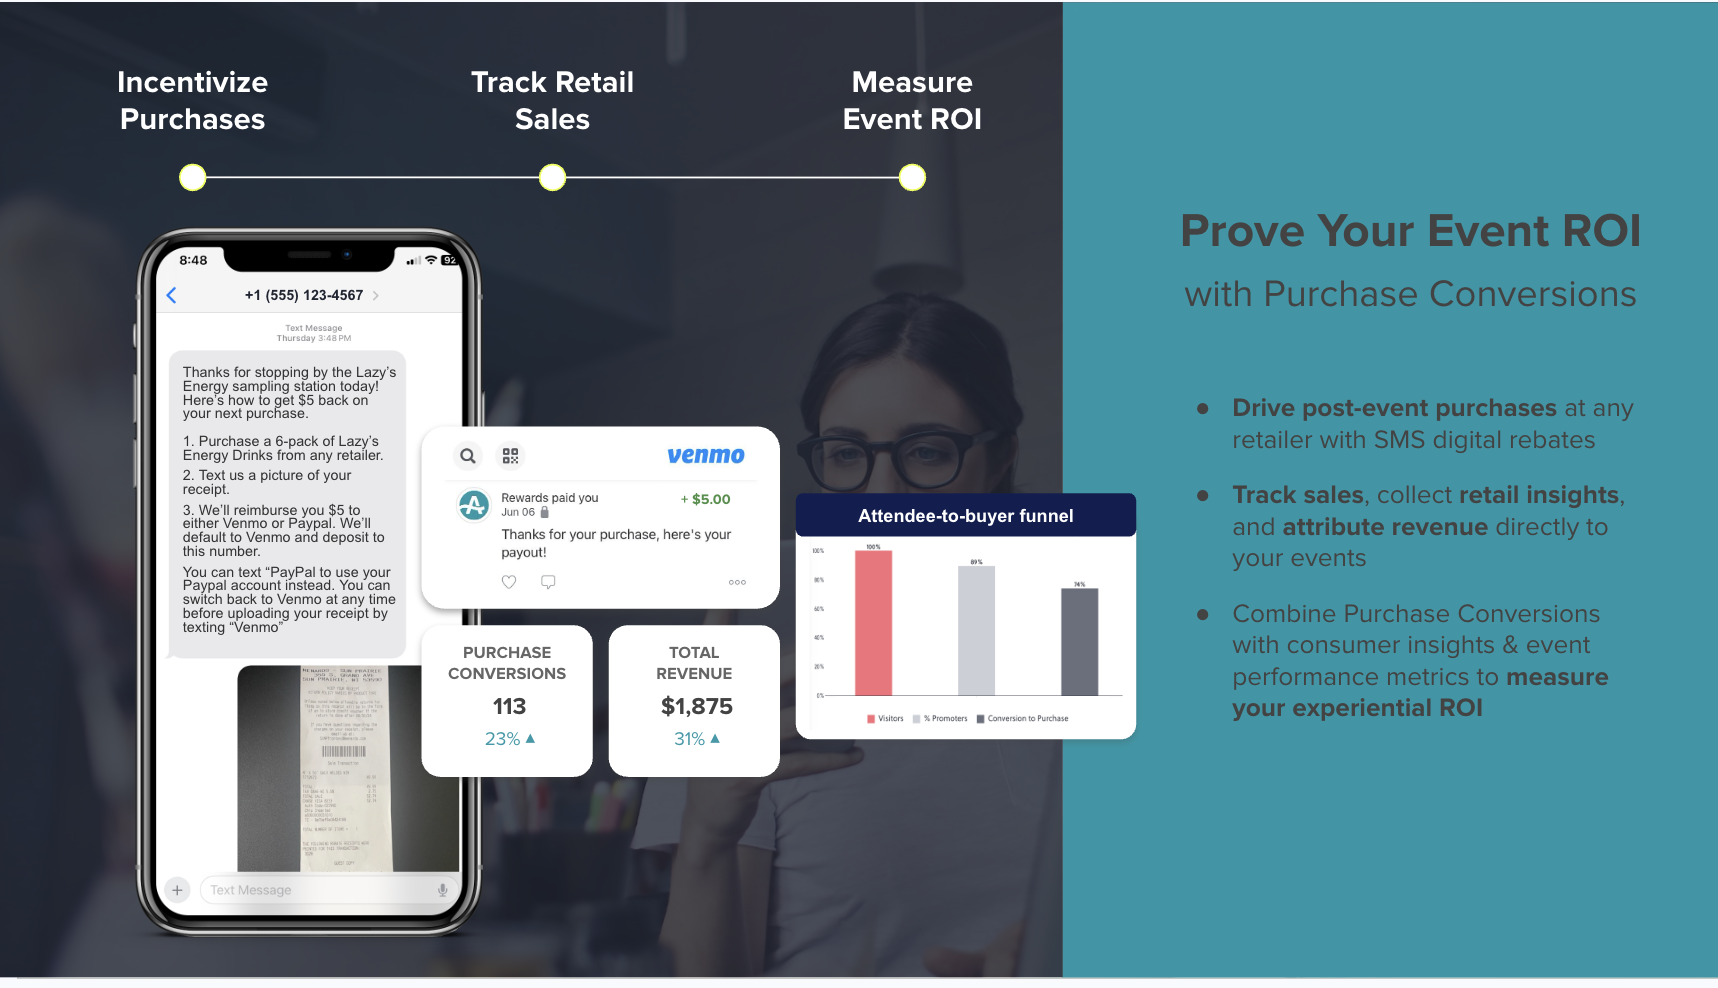
Brands running ambassador tastings inside third-party retail or on-premise accounts can extend this same logic. AnyRoad's Purchase Conversion Tools, including cashback rebates and sweepstakes, produce a first-party record tied to a receipt-verified bottle purchase without requiring any POS integration. In a one-month ambassador tasting pilot with a single unnamed craft brand on a small dataset, 56% of records collected converted to a bottle purchase. That result comes from an early pilot rather than a platform benchmark, yet it illustrates the principle that every mechanic producing a receipt-verified purchase record extends the attribution model beyond the tasting room walls.
Make The Number Defensible
The complete model has five components: a full cost taxonomy in the denominator, revenue per visitor segmented by visitor type, the conversion trio of purchase rate, club conversion rate, and data capture rate, an attribution framework connecting named visitors to later online and club revenue, and the acquisition-cost reframe that gives the visit a payback period. Structured execution and clean data make the number defensible, and the formula alone does not.
AnyRoad captures first-party data from every attendee, connects the visit to club enrollment and later purchase, and supplies white-glove expertise so the measurement model runs. The relevant capabilities are FullView for capturing data from every attendee in a group, Atlas Insights for analytics and NPS and purchase-intent measurement, PinPoint for AI-powered feedback analysis, Purchase Conversion Tools including cashback rebates and sweepstakes for connecting experiences to retail sell-through, Bottle Clubs for converting visits into recurring revenue, and managed CRM services for brands without in-house email capability. The technology and the operating team come as one relationship, which turns a measurement model into a number a CFO will act on.
Talk To AnyRoad About Your Tasting Room ROI.