Written by: Bryan Grobstein, Vice President, Global Revenue, AnyRoad | Last updated: February 24, 2026
Key Takeaways
- QR check-ins capture unique identifiers for 69% more guest data, which enables precise attribution of event attendance to purchases.
- CRM and POS integrations plus AI-powered surveys connect offline events to retail sales data for clear, actionable insights.
- Personalized campaigns with UTM tracking and purchase conversion tools like cashback rebates drive conversion rates up to 85%.
- Attribution models that include CLV reveal true ROI, with examples showing 1,700% returns from well-structured events.
- AnyRoad’s integrated platform delivers end-to-end tracking, so you can schedule a demo and prove your event ROI.
Step 1: Use QR Check-Ins to Capture Every Attendee
Accurate purchase attribution starts with complete attendee data at the door. Manual check-ins miss guests and leave gaps that break the link between events and sales. QR code-based check-ins solve this by capturing unique identifiers for every attendee, not only the booking contact.
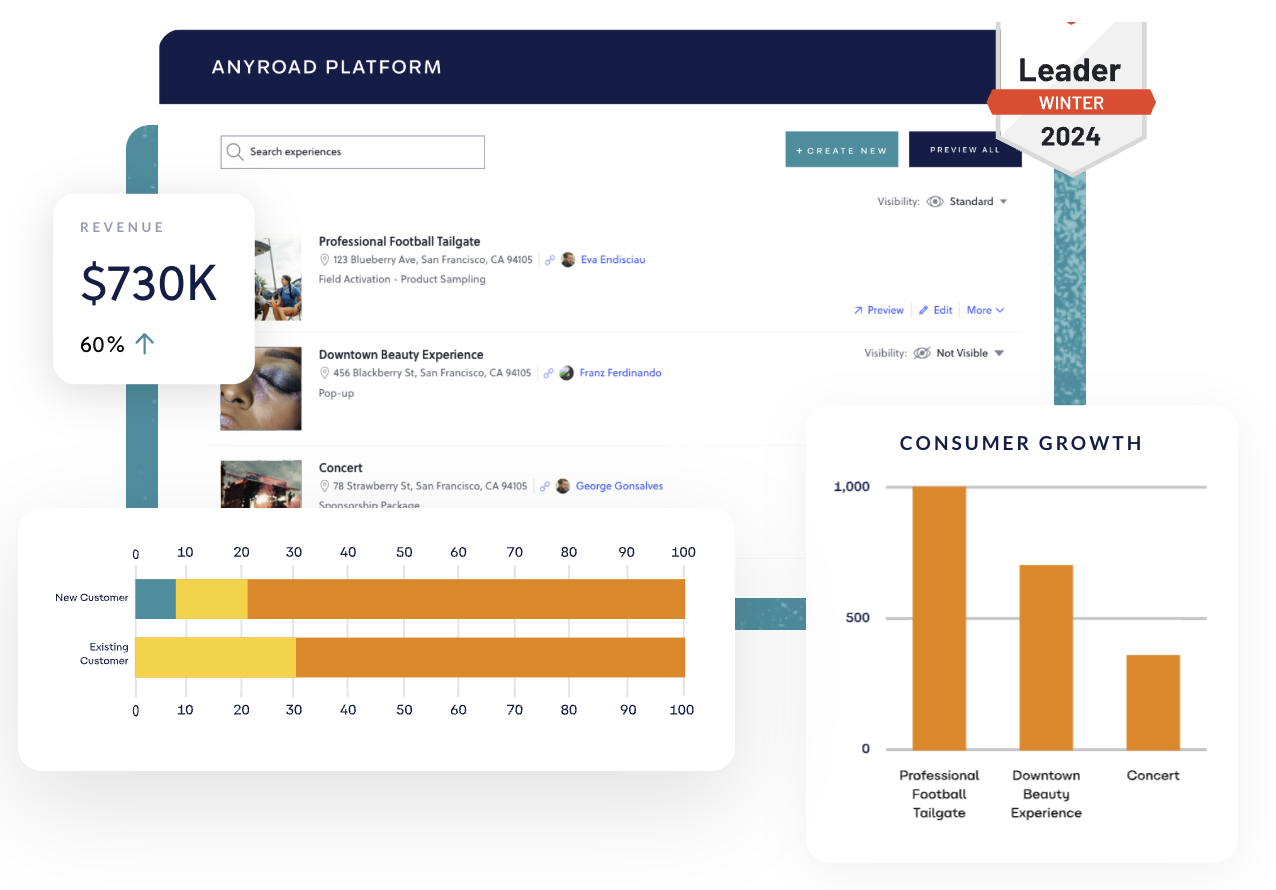
AnyRoad’s Front Desk app with FullView technology follows this model. When Proximo Spirits adopted QR check-ins, they collected 69% more guest data than with their manual process. Strategic QR placement matters too, and QR codes on tables deliver 3× higher scan rates than other locations, which supports stronger post-event attribution.
Teams follow three steps for rollout. First, enable QR code generation for each event. Second, train staff to scan every attendee, including group members. Third, configure custom data fields that capture purchase intent signals. Just Egg used this approach across 300 events and learned that 90% of consumers who taste their product intend to buy it, which is only possible with consistent unique identifier tracking.
Step 2: Connect Event Data to CRM and POS Systems
Attendance data delivers value only when it flows into your core business systems. Priority CRM integrations for event organizers in 2026 include calendars, Zoom, Stripe, analytics, and social live signals, which create a clear path from event attendance to CRM records.
Teams configure webhooks so attendance records sync automatically with platforms like HubSpot, Salesforce, or Klaviyo. Each attendee record should carry an “attended” flag, event details, and survey responses. Integrations with payment systems such as Stripe or Square then connect post-event purchases to specific attendee identifiers.
This approach goes far beyond generic event tools. Eventbrite provides basic CRM exports, but it does not offer native POS integrations that tie offline attendance to retail purchase behavior. AnyRoad’s integration ecosystem connects directly to major CRM, email, and payment platforms, so attendance data enters existing workflows and becomes usable immediately.
Step 3: Turn Post-Event Surveys into AI-Driven Insights
Post-event surveys become a strategic asset when AI analyzes the responses. Standard surveys capture satisfaction scores but overlook deeper behavioral signals that predict purchase. AI-powered analysis uncovers themes, sentiment drivers, and patterns across thousands of comments.
AnyRoad’s PinPoint AI illustrates this shift. The system analyzes open-text feedback in real time and surfaces key themes that create promoters or detractors. Diageo used these insights to adjust flavor profiles and achieved a 16-point NPS increase based on aggregated feedback.
Teams follow three core steps. They send automated surveys within 24 hours of the event. They apply AI to both ratings and open-text responses. They then sync insights back into CRM records for personalized follow-up. QR-based feedback systems improve attendee satisfaction by 25%, which correlates with higher retention and measurable revenue impact.
Prove your event ROI and schedule a demo to see how AI-powered feedback analysis reveals purchase behavior drivers.
Step 4: Run Personalized Post-Event Campaigns with UTM Tracking
Targeted post-event campaigns convert event energy into sales. Generic follow-up emails waste the personal connection created at the event. Effective programs use attendee-level data and UTM tracking to attribute every click and purchase to a specific event.
Most teams start with automated thank-you sequences that send 24 to 48 hours after the event. These messages include tailored product recommendations based on expressed interests, exclusive attendee offers, and clear UTM parameters that tag the source event. SMS often outperforms email for urgent offers or launches that require fast action.
Segmentation quality determines performance. Strong campaigns group attendees by NPS score, product interests, and demographic data captured at registration. This structure allows precise tracking of opens, clicks, and conversions by event and segment, which reveals which experiences and audiences drive the most revenue.
Step 5: Use Purchase Conversion Tools for Direct Sales Attribution
Purchase conversion tools create a direct bridge from event participation to retail sales. These tools give attendees a clear, trackable path from tasting or trial to purchase, which supports precise ROI measurement.
AnyRoad’s Purchase Conversion Tools include cashback rebates, digital punch cards, and sweepstakes entries that reward future purchases while preserving event-level attribution. Brands typically deploy these incentives via SMS to prompt quick action, and redemption data connects each sale back to the original event. Sierra Nevada used this approach and reached an 85% brand conversion rate.
Implementation includes three elements. Teams send incentives via SMS or email after the event. They track redemptions through unique codes or digital wallets. They integrate with retail POS systems to capture purchase data. A centralized redemption dashboard then shows which events generate real sales, so teams can refine campaigns based on revenue instead of engagement alone.
Step 6: Model Event Impact with Customer Lifetime Value
Short-term purchase data tells only part of the ROI story. Attribution models that include customer lifetime value reveal the full impact of experiential marketing. The 2025 CLV formula uses Average Order Value × Purchase Frequency × Customer Lifespan, which highlights repeat value instead of one-time sales.
Event marketers often rely on time-decay attribution, which gives more credit to touchpoints closer to conversion, and W-shaped attribution, which assigns 30% credit to first touch, lead creation, and last touch. For many brands, the initial event acts as the first touch that shapes later purchase decisions.
ROI becomes clear with a simple formula. Event Cost ÷ (Attendees × Conversion Rate × Average CLV) = ROI percentage. A $10,000 event with 100 attendees, an 85% conversion rate, and $200 average CLV generates 1,700% ROI. This structure helps teams defend budgets and design events around long-term value, not only immediate sales.
Schedule a demo to apply comprehensive attribution modeling to your event program.
Step 7: Apply AI Insights to Improve Every Event
Consistent improvement depends on AI that spots patterns across events and touchpoints. AI marketing tools in 2026 analyze intent, motivation, and decision patterns and can lift conversion rates by 40–200% and revenue per visitor by 25–80%.
PinPoint AI highlights optimization opportunities that manual review would miss. The system processes feedback themes, sentiment, and behavior to recommend specific changes. Insights might show that tasting-led events drive 40% higher purchase intent than demos alone, or that certain demographics respond better to particular messages.
Leiper’s Fork Distillery used this method and reached a 97 NPS score while raising tour prices by 33%. Their team focused on what drives promoters versus detractors and then adjusted experience design, pricing, and follow-up to maximize satisfaction and revenue.
Step 8: Track Lifetime Loyalty and Scale High-Value Segments
Long-term success comes from tracking loyalty over time and nurturing high-value guests. Predictive CLV models using AI outperform historical models by 25–40% in accuracy, which supports more precise segmentation.
Lifetime loyalty tracking groups attendees by purchase patterns, engagement frequency, and predicted CLV. High-value segments receive premium event invitations, early product access, and tailored communication. This approach turns one-time visitors into advocates who drive repeat purchases and referrals.
Absolut shows the impact of this strategy, with a 36% increase in guest revenue per visit through structured loyalty tracking and personalized engagement. Their team identifies behaviors that signal long-term value and then designs experiences and messages that strengthen those relationships.
Schedule a demo to put lifetime loyalty tracking at the center of your experiential program.
Conclusion: Turn Events into a Proven Revenue Channel
Brands connect event attendance to post-event purchases by combining integrated tools, clear processes, and consistent analysis. The eight steps in this guide, from QR check-ins to loyalty tracking, form a framework that turns experiential marketing into a measurable revenue engine.
Platform integration creates the real advantage. Eventbrite focuses on demand generation and offers limited purchase tracking. AnyRoad delivers end-to-end attribution from registration through long-term CLV. This approach helps brands like Proximo Spirits capture 69% more guest data and supports Diageo’s 16-point NPS lift.
Success depends on disciplined data capture, AI-driven analysis, and ongoing optimization based on purchase behavior. Brands that follow this model see results such as 85% conversion rates, 36% revenue-per-visit gains, and clear ROI for experiential investments.
Schedule a demo to start turning your events into a predictable revenue channel.
ROI Calculation Framework
| Input | Formula | Example Output |
|---|---|---|
| Event Cost | Total event expenses | $10,000 |
| Attendees | Total unique attendees | 100 |
| Conversion Rate | % who purchase post-event | 85% |
| Average CLV | AOV × Frequency × Lifespan | $200 |
| ROI | (Attendees × Conv. Rate × CLV - Cost) ÷ Cost × 100 | 1,700% |
Platform Comparison: AnyRoad vs Competitors
| Feature | AnyRoad | Eventbrite | FareHarbor |
|---|---|---|---|
| Purchase Tracking Tools | Yes - Cashback, rebates, punch cards | No | No |
| Data Ownership | Full brand ownership | Co-owned with platform | Brand owned |
| AI Feedback Analysis | Yes - PinPoint AI | No | No |
| CRM/POS Integration | Native integrations | Limited exports | Basic booking data |
Frequently Asked Questions
What attribution models work best for measuring event CLV impact?
Time-decay attribution works well for event marketing because it gives more weight to recent touchpoints while still recognizing the full journey. W-shaped attribution also performs strongly, with 30% credit assigned to the initial event touch, the lead creation moment, and the final purchase decision. For complex B2B cycles that involve several events, linear attribution can provide equal credit to each touchpoint. Teams should match models to their sales cycle length, using time-decay for cycles under 30 days, W-shaped for clear discovery and decision phases, and custom models for multi-touch journeys that require deeper analysis of which events correlate with closed deals and higher lifetime value.
How do you capture data from all event attendees, not just the booking contact?
Teams capture full attendee data by using structured QR check-in flows that scan every person, not only the booking contact. AnyRoad’s FullView technology follows this pattern. Staff scan QR codes for each guest on arrival and collect individual contact details, preferences, and survey responses. Proximo Spirits used this method and gathered 69% more guest data than with manual check-ins. The process includes strategic QR placement at entry, staff training to scan all group members, and custom data fields that record purchase intent and demographic details for each attendee.
What specific tools bridge offline events to retail purchase tracking?
Purchase conversion tools connect offline events to retail sales through trackable incentives and redemptions. Common tools include SMS cashback rebates, digital punch cards for repeat purchases, sweepstakes entries tied to product buys, and exclusive discount codes with unique identifiers. Integration with retail POS systems captures redemption data and attributes each sale to a specific event. AnyRoad’s Purchase Conversion Tools helped Sierra Nevada reach 85% conversion by sending SMS incentives right after events, tracking redemptions with unique codes, and using dashboards that link attendance directly to sales.
How long does it typically take to see ROI from event purchase tracking implementation?
Most brands see early ROI signals within 30 to 90 days, depending on sales cycle length and event cadence. Email engagement metrics appear within days, and purchase attribution data usually emerges within 2 to 4 weeks as attendees buy. Long-term CLV impact becomes visible within 3 to 6 months as repeat purchases build. Diageo recorded a 16-point NPS lift in the first quarter, and Absolut saw a 36% increase in revenue per visit within six months. Teams should set baseline metrics before rollout and then track engagement, conversion, and revenue attribution as the system matures.
What integration capabilities are essential for connecting event data to existing marketing systems?
Core integrations include CRM platforms like HubSpot and Salesforce for attendee sync, email tools like Klaviyo for automated follow-up, and payment systems such as Stripe and Square for purchase tracking. Webhooks support real-time data flow, and APIs power more advanced workflows. AnyRoad offers native integrations with major marketing automation platforms, which keeps attendance data aligned with existing processes. Strong ecosystems also connect to POS systems for retail attribution, survey tools for feedback, and business intelligence platforms for full ROI reporting across events and customer segments.