


Written by: Bryan Grobstein, Vice President, Global Revenue, AnyRoad
Key Takeaways
- Brand home ROI uses a fully loaded cost denominator that includes year-round venue overhead, staffing, and amortization. Event-day spend is only a fraction of total cost.
- A defensible scorecard organizes metrics into five distinct buckets: Audience Quality, Experience, Commercial, Brand, and Long-Tail Value. Each bucket serves different stakeholders.
- Leading indicators like attendance and NPS stay separate from lagging ROI metrics such as revenue per attendee and repeat-visit revenue.
- Brand lift should be reported as percentage-point change from pre/post surveys with control groups, never converted into a dollar figure or merged with cash revenue.
- AnyRoad provides integrated data capture, attribution, and long-tail tracking tools that support a defensible brand home ROI scorecard.
See How AnyRoad Builds Your Scorecard
Before You Begin: Data Foundations For Your Scorecard
This playbook serves brand home managers, experiential marketing directors, and field marketing leaders who already understand ROI and now need the actual scorecard. You will see which metrics belong in which bucket, which formulas to use, how to set the attribution window, and how to present brand lift without turning it into an arbitrary dollar figure.
Before building the scorecard, confirm access to these data sources:
- Ticketing and booking data from the brand home’s reservation system
- On-site guest data capture, including data from every attendee in a group, not only the person who booked
- Post-visit survey data with consistent question wording across periods
- Retail or ecommerce sales data linkable to individual visitors
- Finance’s cost breakdown for the brand home, including fixed overhead and variable per-visit costs

The sections below cover measurement before, during, and after a brand home visit, and address benchmark and common-mistake questions directly.
Step 1: Define What Belongs In Total Cost For A Permanent Brand Home
The standard ROI formula is straightforward. The denominator often creates confusion. For a permanent venue, total cost includes every dollar required to keep the venue open and operational year-round.
A complete total-cost model for a permanent brand home includes:
- Venue Overhead: lease or mortgage, property and casualty insurance, and utilities. Permanent venue fixed costs such as lease, insurance, and utilities continue regardless of utilization, so every unfilled date still carries a cost.
- Year-Round Staffing: full-time and part-time staff, not only event-day labor. Staffing typically represents 30 to 45 percent of a total experiential marketing budget, and for a permanent brand home that cost recurs every month.
- Fabrication Amortization: buildout costs spread across the venue’s lifespan. Reusable builds should be amortized over multiple deployments, with refurbishment budgeted at 5–10% of original fabrication cost per cycle. A $1M buildout amortized straight-line over a 10-year lease term costs $100,000 per year. That assumes the buildout’s useful life is at least as long as the lease term. Accounting standards require amortizing over the shorter of the two. That annual figure belongs in the denominator, not the full $1M against a single season’s revenue.
- Technology And Ticketing Costs: booking platform fees, data capture tools, survey tooling, and analytics infrastructure.
- Per-Visit Variable Costs: sampling inventory, consumables, and on-site labor that scales with attendance.
The numerator must include long-tail revenue alongside same-day spend. A single retail bottle purchase is worth roughly $100 to a brand. A club member who stays through six releases is worth roughly $600. That sixfold difference explains why the scorecard must capture both figures and why the revenue column stays open well past the day of the visit.
Cost per Qualified Attendee = Total Brand Home Cost ÷ Number of Qualified AttendeesThis formula replaces raw attendance as the primary efficiency metric. It forces the cost denominator into every conversation about throughput.
Step 2: Build The Five-Bucket Brand Home Scorecard
A defensible brand home scorecard organizes metrics into five distinct buckets. Each bucket answers a different question for a different stakeholder. Finance focuses on the commercial and long-tail buckets. Operations focuses on the experience bucket. Marketing focuses on the audience quality and brand buckets.
Bucket 1: Audience Quality
- Cost per qualified attendee
- First-party data capture rate
- Opt-in rate
- Repeat-visit rate
Attendance volume belongs here as a leading indicator, not in the ROI column. Opt-in rate drives hard ROI more than creative concept. A 45% opt-in rate on 500 attendees versus a 15% rate can separate a profitable activation from a break-even one. Proximo Spirits found they were missing contact information for over 66% of their guests before implementing AnyRoad’s FullView feature, which immediately began collecting 69% more guest data.
Bucket 2: Experience
- Net Promoter Score
- Guest satisfaction score
- Tour completion rate
- On-site conversion rate
Diageo measured a 16-point NPS increase from pre-visit to post-visit at Johnnie Walker Princes Street using AnyRoad analytics. Leiper’s Fork Distillery achieved a near-perfect 97 post-event NPS using AnyRoad. That benchmark shows what a well-instrumented brand home can produce.
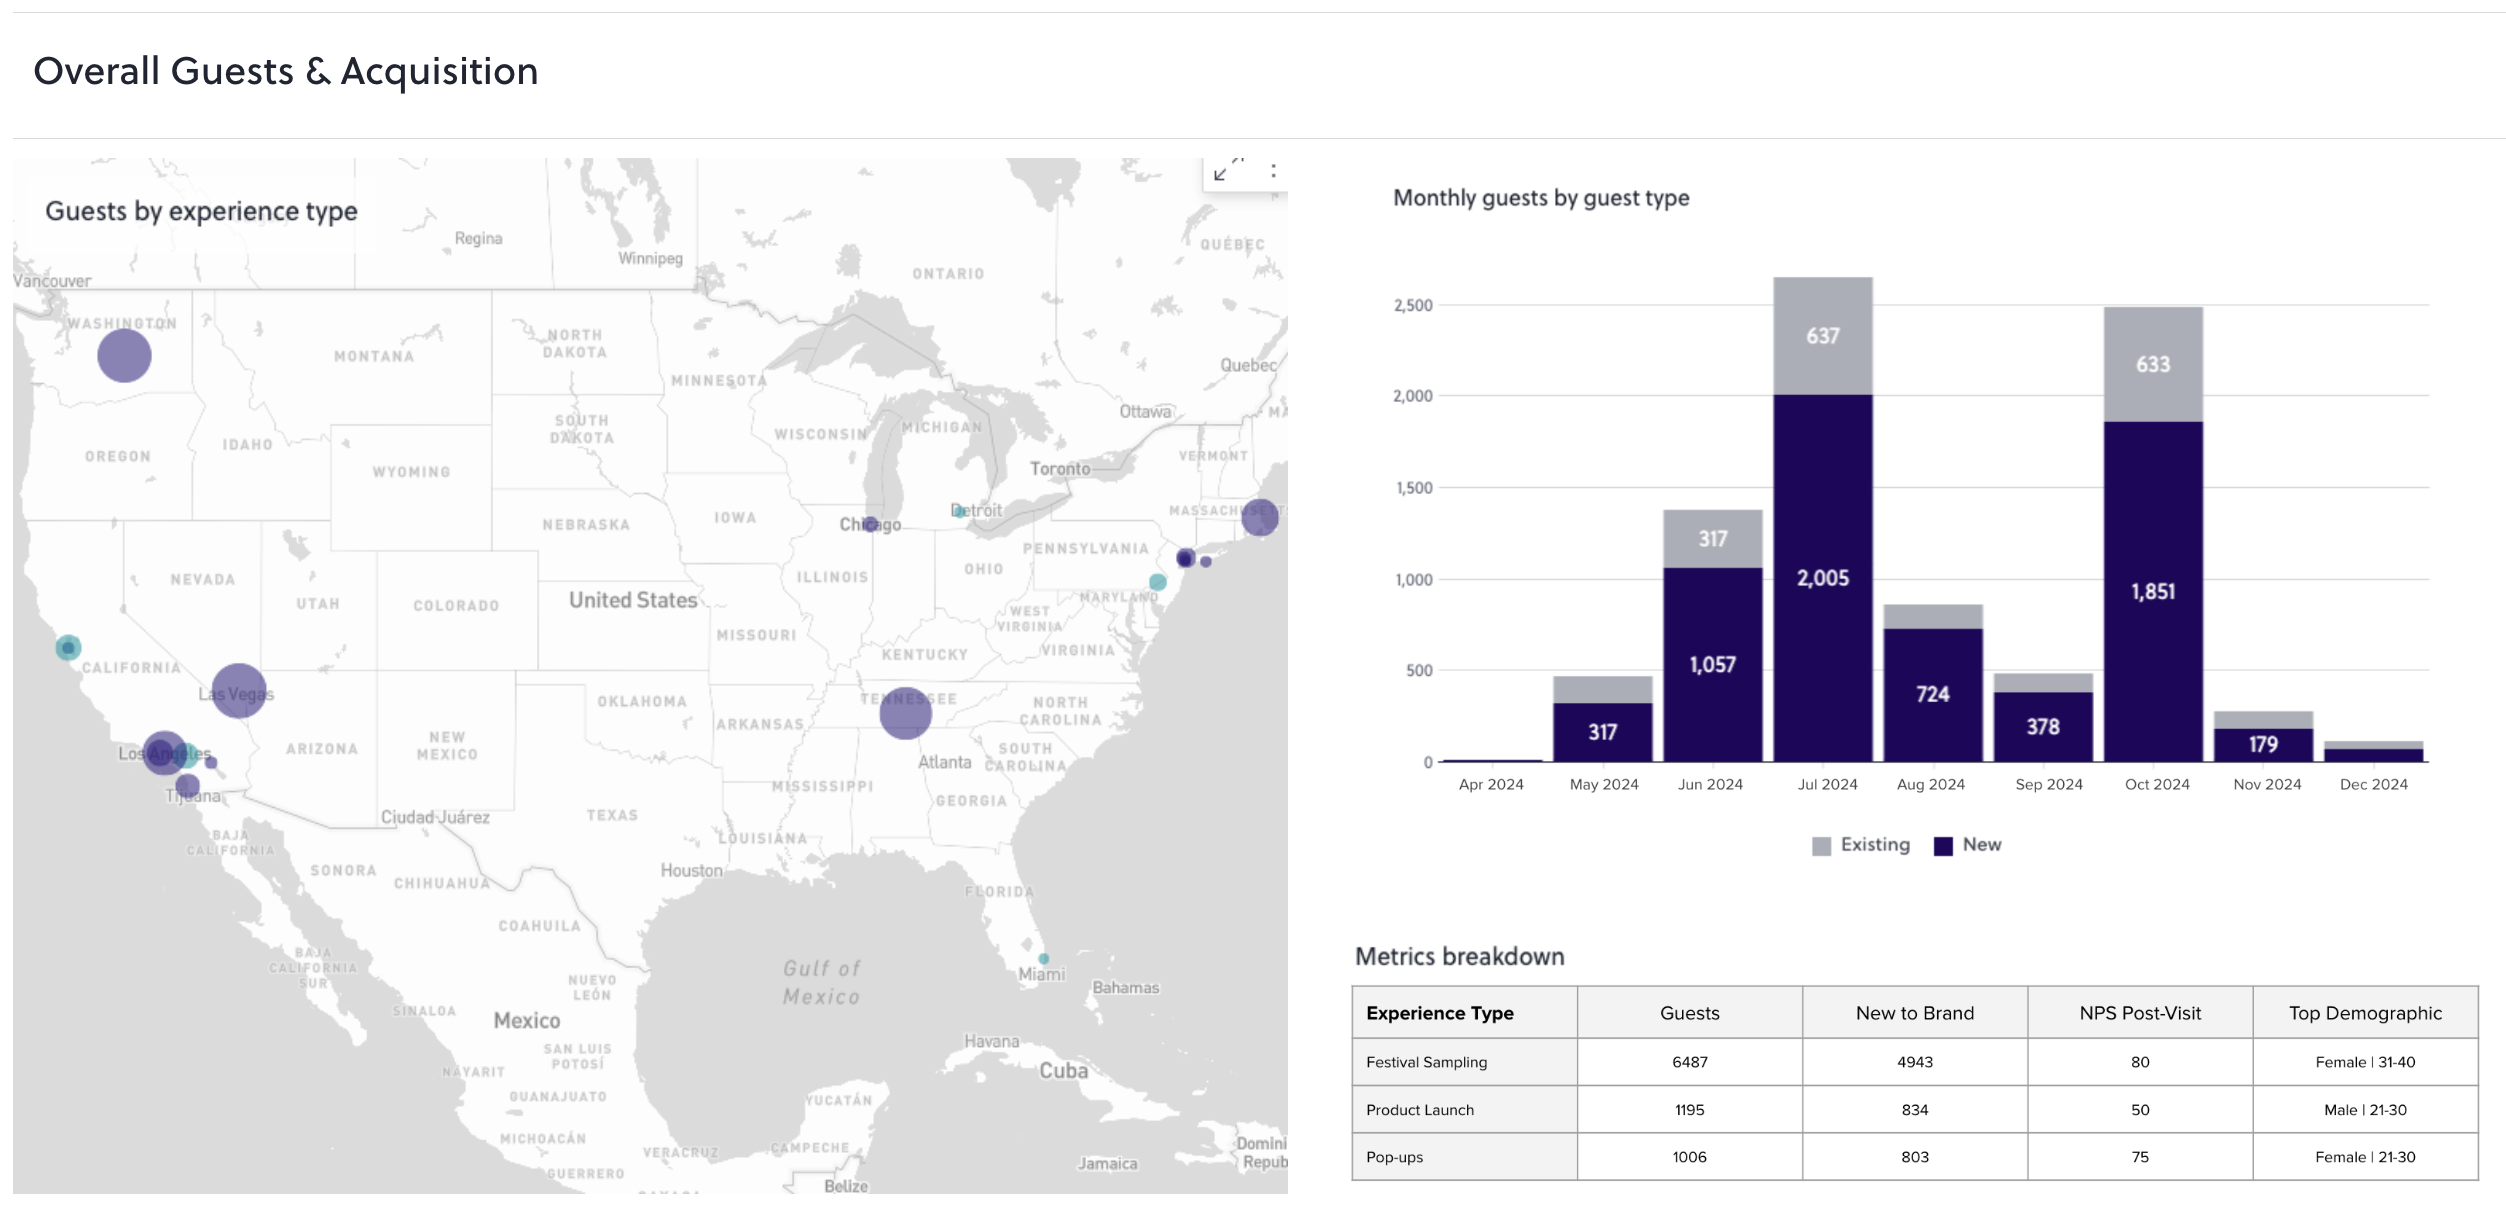
Bucket 3: Commercial
- Revenue per attendee
- On-site retail conversion rate
- Average transaction value
- Cost per qualified attendee
Absolut improved guest revenue per visit by 36% using AnyRoad data by using insights to adjust group size and experience design. Campari Group has used AnyRoad to streamline event management and integrate its systems across brand experiences.
Bucket 4: Brand
- Brand affinity lift
- Purchase intent lift
- Aided and unaided awareness lift
These metrics belong in a separate column from cash revenue. AnyRoad analytics showed that a historically under-targeted demographic was 40% more likely to drink whisky after visiting Johnnie Walker Princes Street. That behavioral change metric belongs in the brand bucket and should be reported as a percentage-point lift rather than a dollar figure.
Bucket 5: Long-Tail Value
- Repeat-visit revenue
- Membership or club enrollment rate
- Customer lifetime value
- Second-visit conversion rate
AnyRoad’s data shows that a consumer who visits a distillery twice is 512% more likely to convert into a paid loyalty enrollment. That figure makes the first visit an acquisition event for the second, and the second visit a strong signal of intent. Experience-driven opt-ins convert to paid loyalty at four times the rate of traditional channels, according to AnyRoad’s own reporting. The long-tail bucket is where the brand home’s permanent-asset advantage over a one-off activation becomes most visible. The table below shows how the five-bucket scorecard compares to simpler measurement approaches and what each one fails to capture.

| Measurement Approach | What It Captures | What It Misses | Best For |
|---|---|---|---|
| Attendance and Impressions | Volume of visitors and reach | Revenue connection and cost denominator | Leading indicator reporting |
| Same-Day Revenue | On-site spend and immediate retail conversion | Long-tail repeat-visit value and club enrollment revenue | Immediate ROI snapshot |
| Full Five-Bucket Scorecard (AnyRoad) | Revenue, brand lift, long-tail value, and first-party data | Requires clean individual-level data capture and a documented attribution window to be reliable | Defensible ROI proof for finance and leadership |
With the five buckets defined, the next decision is how long to keep the revenue column open. That decision sets the attribution window.
Step 3: Choose Your Attribution Window
The attribution window is the period during which revenue can be credited to a brand home visit. The window must be set before the event and documented in the pre-event plan or campaign brief. Moving it after results are known destroys credibility with finance teams.
HubSpot’s attribution window guidance recommends matching window length to the actual sales cycle: 1–7 days for fast, low-consideration purchases and 30–90 days for long sales cycles involving extended research and multi-stakeholder involvement. For consumer alcohol brands, a 30–60 day window captures most post-visit retail behavior. For high-consideration purchases such as premium spirits, club memberships, or multi-bottle allocations, a 90-day window fits better.
A typical B2B or high-consideration journey spans 60–90 days or longer, during which prospects research, compare, and navigate approval processes. The same dynamic applies to a consumer deciding whether to join a bottle club after a distillery visit.
Repeat visits change the attribution math. That second-visit lift means the first visit creates the condition for the second. The attribution model should credit the first visit for generating that intent, so the window for first-visit attribution should remain open long enough to capture the second-visit enrollment event.
The practical tradeoff is clear. A short window undercounts long-tail value and makes the brand home look less efficient than it is. A long window overcounts unrelated revenue and makes the analysis look inflated. Document the window, apply it consistently, and never adjust it after results are known.
Step 4: Measure Brand Awareness Lift From A Brand Home
Brand lift from a brand home visit is real and measurable, and it belongs in its own column. Finance teams reject analyses that mix cash revenue with brand-lift estimates. Converting organic reach into a notional CPM and adding it to the revenue column quickly erodes credibility. Hard revenue and soft brand metrics must be kept in separate columns in every report presented to finance.
The correct methodology for measuring brand awareness lift from a brand home uses pre- and post-visit surveys with a control group and consistent question wording. A well-designed brand awareness survey sequence includes four core question areas in this order: unaided category recall, brand familiarity, aided recall, and consideration. The sequence moves from spontaneous memory to prompted recognition to future purchase intent. Asking aided recall before unaided recall contaminates the unaided data.
Brand lift is typically reported as a percentage-point change, or absolute lift, rather than a dollar figure, because the study’s core output is a measured change in perception. Absolute lift is calculated as the exposed group’s positive response rate minus the control group’s positive response rate.
AnyRoad’s Atlas Insights measures brand affinity, Net Promoter Score, and purchase intent at the individual visitor level. PinPoint’s AI-powered feedback analysis turns open-text survey responses into themes and sentiment drivers, surfacing the specific experience elements that move visitors from awareness to consideration. Absolut Home maintained a consistent brand conversion score of 85% post-event. That figure belongs in the brand bucket and appears alongside, not merged with, revenue metrics.

Step 5: Define What “Good” ROI Looks Like For Your Brand Home
No universal numerical threshold exists for a “good” ROI from a brand home. Any source that offers one fabricates a benchmark. The defensible answer depends on three factors specific to each brand home:
- Cost Structure: A brand home with a $2M+ flagship buildout carries a higher amortization load than a mid-scale venue. A $1M mid-scale brand experience center hosting 2,000 visitor-meetings per year over a 10-year lifespan delivers roughly $50 per impression. That figure sits far below the $200–$500 cost per qualified interaction at a major trade show. The cost structure shapes what ROI is achievable.
- Venue Maturity: New venues carry higher amortization loads and lower repeat-visit rates. ROI improves as the venue builds its audience and repeat-visit dynamics compound.
- Asset Framing: A brand home treated as a permanent revenue and relationship asset will be measured differently and will perform differently than one treated as a recurring campaign.
The right way to frame “good” ROI for leadership is comparative and context-specific:
- Compare the brand home’s cost per qualified attendee against the brand’s other marketing channels
- Compare the brand home’s current period against its own prior periods
- Compare the cost of acquiring the same customer through paid digital channels against the cost of acquiring them through the brand home
Leiper’s Fork Distillery raised tour prices by 33% using insights from AnyRoad and recorded its third-highest grossing month ever despite conducting fewer tours. That story shows the same asset, better instrumented, generating more revenue per visit.
Common ROI Measurement Mistakes In Experiential Marketing
The following mistakes appear consistently in brand home measurement programs. Each has a diagnosable cause and a specific fix.
Mistake 1: Counting Impressions Or Attendance As ROI. Attendance is a leading indicator. It tells you how many people showed up and nothing about whether the brand home generated more revenue than it cost. The fix is to report attendance in the audience quality bucket and reserve the ROI column for cost per qualified attendee and revenue per attendee. The cause is usually a process gap: no one defined the difference between a leading indicator and an ROI metric before the measurement plan was built.
Mistake 2: Double-Counting Influenced Pipeline As Generated Pipeline. Pipeline influenced by the brand home means a prospect who would have converted anyway had a brand home touchpoint in their journey. Pipeline generated means the brand home created a new opportunity that would not have existed otherwise. Only the latter belongs in the ROI numerator. The cause is unclear ownership between marketing and sales on pipeline attribution definitions.
Mistake 3: Ignoring Long-Tail Repeat-Visit Revenue. A brand home that measures only same-day spend undercounts its own value. The second-visit lift mentioned earlier means the first visit creates the condition for the second, and the second visit is where paid loyalty enrollment often happens. The fix is to track repeat-visit rate, second-visit conversion, and revenue per returning visitor within the documented attribution window. The cause is a data gap: no system connecting the first visit record to the second.
Mistake 4: Leaving Venue Overhead And Year-Round Staffing Out Of Total Cost. Brands frequently budget only hourly ambassador rates and forget training time, travel, and agency management overhead. For a permanent brand home, that error compounds across 52 weeks. The fix is to amortize permanent venue costs across the venue’s lifespan and include year-round staffing in the denominator. The cause is that event-level budgeting templates were built for one-off activations and never adapted for permanent venues.
Mistake 5: Treating Brand Lift As A Dollar Figure. Brand lift studies cannot directly measure incremental sales; that requires a conversion lift study or sales-based experiment. Converting brand affinity lift into a notional revenue figure and adding it to the ROI numerator produces a number finance will reject. The fix is to report brand lift separately, using pre/post surveys with control groups and consistent question wording. The cause is pressure to show a single ROI number rather than a two-column report.
Leading Vs. Lagging Indicators For Brand Home ROI
Conflating leading and lagging indicators quickly erodes credibility with a CFO. The distinction is structural, not semantic.
Leading indicators are early signals that the brand home is working. They are available quickly and are useful for operational decisions, but they do not prove ROI on their own:
- Attendance and footfall
- First-party data capture rate
- Opt-in rate
- Net Promoter Score
- Tour completion rate
Lagging indicators are the ROI proof. They take longer to accumulate and are what finance needs to justify the brand home’s budget:
- Revenue per attendee
- Repeat-visit revenue
- Club or membership enrollment rate
- Customer lifetime value
- Second-visit conversion rate
Melissa Levy, President of Sparks, outlined a three-horizon measurement framework at Cannes Lions 2026: immediate metrics such as dwell time and foot traffic; medium-term metrics including brand awareness lift and consideration shifts; and the hardest-to-capture horizon of whether the interaction produced something that would not have happened anywhere else. The leading and lagging distinction maps directly onto her first two horizons. The third horizon, behavioral change, is what the long-tail bucket is designed to capture.
Present both sets to leadership in the same report, in separate columns. Leading indicators show the brand home is generating the conditions for ROI. Lagging indicators show whether those conditions converted into revenue. A brand home that scores well on leading indicators but poorly on lagging ones has a conversion problem rather than an awareness problem.
How AnyRoad Measures Brand Home ROI
AnyRoad is built specifically for the measurement architecture described in this playbook. It captures first-party data at every touchpoint, connects experiences to retail sales, and tracks long-tail revenue through memberships and bottle clubs. These three capabilities make a defensible brand home scorecard possible.

The platform’s core capabilities map directly onto the five-bucket scorecard:
- Configurable Booking Embedded On The Brand’s Own Site: keeps the brand in control of the consumer journey from the first interaction and captures pre-visit data before the guest arrives.
- FullView Data Capture: collects data from every attendee in a group, not only the person who booked. This closes the most common audience quality data gap: missing contact information for the majority of visitors.
- Front Desk App: handles on-site check-in, payments, and digital waiver management, generating commercial bucket data in real time.
- Atlas Insights: measures brand affinity, NPS, and purchase intent at the individual visitor level, populating the brand bucket with pre/post survey data that can be reported as percentage-point lift.
- PinPoint AI-Powered Feedback Analysis: turns open-text survey responses into themes and sentiment drivers, identifying which specific experience elements move visitors toward consideration and purchase intent.
AnyRoad’s Lifetime Loyalty suite closes the gap between a visit and recurring revenue. Bottle Clubs, Premium Memberships, and gamified purchase conversion tools, including cashback rebates and sweepstakes, populate the long-tail bucket with measurable, attributable revenue. On-site enrollment during a distillery visit is the highest-converting channel, and AnyRoad coaches the tour guides, retail managers, and mixologists who make the enrollment pitch, not only the teams that manage the software.
The durable figures that make the long-tail case: a consumer who visits twice is 512% more likely to convert to paid loyalty enrollment. The $100 bottle versus $600 club member gap mentioned earlier is what the long-tail bucket is built to capture. Experience-driven opt-ins convert to paid loyalty at four times the rate of traditional channels, according to AnyRoad’s own reporting.
Brands that have adopted AnyRoad’s Lifetime Loyalty platform include Heaven Hill Distillery, Nearest Green Distillery, Lux Row Distillers, Castle & Key, Catoctin Creek Distilling, and Tarnished Truth Distilling. AnyRoad acts as the brand’s agent, and the compliant transaction and delivery happen through its licensed ecommerce partner.
For brands without in-house email marketing capability, AnyRoad’s managed CRM services run programmatic emails and campaign management on top of the same first-party experiential data the platform already collects. That data includes NPS, spend, visit frequency, and club status, and flows without a manual export or a separate email service provider.
Explore AnyRoad’s ROI Platform
Frequently Asked Questions
How Should We Frame ROI For Leadership When There Is No Industry Benchmark?
A “good” ROI depends on the brand home’s cost structure, its maturity as a venue, and whether the team treats it as a permanent asset or a recurring campaign. New venues carry higher amortization loads and lower repeat-visit rates, so ROI in the first year will sit below ROI in year three or four. The defensible way to frame the answer for leadership is comparative: compare the brand home’s cost per qualified attendee against other marketing channels, compare the current period against the brand home’s own prior periods, and compare the cost of acquiring the same customer through paid digital channels against the cost of acquiring them through the brand home.
What Are Common ROI Mistakes In Experiential Marketing?
The five most common mistakes are: counting impressions or attendance as ROI rather than as leading indicators; double-counting influenced pipeline as generated pipeline in the ROI numerator; ignoring long-tail repeat-visit revenue and second-visit conversion; failing to include venue overhead, fabrication amortization, and year-round staffing in total cost; and treating brand lift as a dollar figure by converting it into a notional revenue estimate and merging it with cash revenue. Each mistake has a diagnosable cause, such as a process gap, a data gap, or unclear ownership between marketing and finance, and each has a specific fix described in the scorecard architecture above.
What Is The KPI For Brand Awareness?
Brand awareness KPIs include unaided recall (naming a brand without prompting), aided recall (recognizing a brand when shown it), brand familiarity, and consideration (likelihood to include the brand in the next purchase decision). These are measured through pre- and post-visit surveys with consistent question wording, a control group, and a fixed survey sequence that moves from unaided recall to aided recall to consideration in that order. Asking aided recall before unaided recall contaminates the unaided data. Results are reported as percentage-point lift against the control group, not as a dollar figure.
What Are ROI And KPIs?
ROI is a financial ratio: (Revenue − Cost) ÷ Cost × 100. It requires both a revenue numerator and a cost denominator. KPIs are the specific metrics tracked to measure progress toward a goal. Attendance is a KPI. Revenue per attendee is an ROI metric. NPS is a KPI. Brand affinity lift is a brand-bucket metric. The distinction matters because conflating KPIs with ROI metrics is a common reason brand home measurement loses credibility with finance.
How Long Should You Track Revenue After A Brand Home Visit?
Consumer brands can use a 30–60 day attribution window for most post-visit retail behavior. B2B and high-consideration purchases, including premium spirits, club memberships, and multi-bottle allocations, warrant a 90-day window. The window must be set before the event and documented in the pre-event plan. It must never be moved after results are known. For repeat-visit dynamics, the first-visit attribution window should remain open long enough to capture the second-visit enrollment event, since the second-visit lift mentioned earlier means the first visit creates the condition for the second.
How Do You Measure Brand Home ROI Without A POS Integration?
Use receipt-based verification, cashback rebates, or sweepstakes entries to capture purchase data. AnyRoad’s gamified purchase conversion tools run on the receipt, so they work in any retail or on-premise account without requiring a POS integration. The consumer buys the bottle, photographs the receipt, and texts it back. AnyRoad’s AI reads the receipt, confirms the eligible SKU, and pays the rebate via Venmo or PayPal. Every redemption produces a first-party record tied to a receipt-verified purchase, connecting experiential spend to retail sell-through without touching the retailer’s point-of-sale system.
What Is The Difference Between Pipeline Influenced And Pipeline Generated?
Pipeline influenced means the brand home touched a prospect who would have converted anyway, so the brand home acted as a touchpoint in a journey that was already underway. Pipeline generated means the brand home created a new opportunity that would not have existed otherwise, so the visit initiated the relationship. Only pipeline generated belongs in the ROI numerator. Mixing the two inflates the revenue figure and produces an analysis finance will reject. The fix is to define both terms explicitly in the measurement plan before the attribution window opens and to assign ownership of the distinction to a named person in marketing or sales operations.
How Do You Measure Repeat-Visit Revenue?
Track repeat-visit rate, second-visit conversion rate, and revenue per returning visitor within the documented attribution window. A second visit is a strong signal of intent and should be credited to the first visit’s attribution window. A system that captures data from every attendee, not only the person who booked, is a prerequisite for this measurement. A returning visitor who booked under a different name or in a different group will not be recognized without individual-level data capture at both visits.
Conclusion: Build The Scorecard That Reflects The Asset
A brand home functions as a permanent revenue and relationship asset. Its ROI scorecard must reflect year-round costs, repeat-visit dynamics, and long-tail revenue, rather than the event-day metrics of a one-off pop-up activation. The measurement architecture includes the core ROI formula with a fully loaded cost denominator, the five-bucket scorecard organized by stakeholder, a documented attribution window set before the first visit, and a clean separation of leading indicators from lagging ROI proof.
Brand lift belongs in its own column, reported as percentage-point lift against a control group. Attendance belongs in the audience quality bucket, not the ROI column. Repeat-visit revenue and club enrollment belong in the long-tail bucket, tracked within the attribution window and credited to the first visit that created the condition for the second.
Structured execution and clean first-party data make the scorecard defensible. Without individual-level data capture from every attendee, the audience quality bucket remains incomplete. Without a documented attribution window, the commercial and long-tail buckets remain contestable. Without pre/post survey data with consistent question wording, the brand bucket remains anecdotal. AnyRoad captures all of it, from the booking through the second visit and into the club enrollment, in a single platform built for permanent brand homes.
See How AnyRoad Powers Your Brand Home