


Written by: Bryan Grobstein, Vice President, Global Revenue, AnyRoad
Key Takeaways
- Most event ROI figures miss the mark because teams build tracking after the event instead of before launch.
- Effective pre-event planning requires a named owner, platform access, cost data, CRM integration, and a defined follow-up window.
- ROI tracking follows a repeatable framework with six steps that cover goals, tracking, costs, attribution, measurement cadence, and third-party events.
- Frequent errors include ignoring soft costs, ending measurement too early, and double-counting influenced revenue.
- AnyRoad supplies first-party data capture, analytics, and purchase conversion tools that support defensible ROI reporting.
See how AnyRoad supports end-to-end event ROI tracking.
See How AnyRoad Tracks Event ROI
Before You Begin: Core Requirements For Event ROI Tracking
Successful ROI tracking starts with five prerequisites in place.
- A named owner for the tracking plan
- Access to the registration or booking platform
- The finance or operations partner who supplies cost data
- The CRM or marketing automation system that will hold post-event records
- The event date plus the agreed follow-up window
This process applies before, during, and for 90 days after an event promotion. The setup work happens pre-launch. 97% of event budgets contain no line item for data-capture or measurement costs, which means teams often omit instrumentation cost from the ROI calculation. Treat measurement as a budget line and a workstream that starts before launch.
Explore how AnyRoad can plug into your existing event workflow.
Talk To AnyRoad About Your Events
How To Track ROI For Event Promotions: 6 Practical Steps
Step 1: Define The Goal And Success Threshold Before Launch
Objective: Establish what success looks like before any promotion goes live.
Action: Choose a primary success metric such as registrations, attendance, opt-ins, pipeline creation, or retail sell-through. Write the threshold down before the event runs. For example: “This activation must generate 150 qualified opt-ins and $15,000 in attributed pipeline within 90 days.”
Checkpoint: A signed-off success threshold that leadership has reviewed before the event date.
Step 2: Build The Tracking Plan
Objective: Create the instrumentation that will capture data at every touchpoint.
Action: Document four elements clearly.
- The attribution rule (see Step 4)
- The UTM naming convention (e.g., utm_source=anyroad, utm_medium=event, utm_campaign=[event-name]_[date])
- Unique promo codes for each channel and partner
- The fields that must be captured at registration and on site
Inconsistent UTM tagging, such as “LinkedIn” versus “linkedin” or “paid-social” versus “paidsocial,” is the number-one corruptor of attribution. It fragments a single channel into phantom variants and dumps traffic into direct/none. Enforce the naming convention before the first campaign goes live.
Checkpoint: A tracking plan document that anyone on the team can execute without extra clarification.
Step 3: Capture Total Cost
Objective: Account for every dollar spent, including less visible expenses.
Action: Categorize costs into three buckets.
Hard costs: Venue, talent, production, media, catering, AV, signage.
Soft costs: Internal staff time calculated as fully loaded hourly rate × hours, follow-up labor, travel, and lodging.
Hidden fees: Platform fees, payment processing, compliance review, and post-event administrative work.
Teams often forget specific line items that sit inside those buckets, which weakens the ROI number.
- Staff time for pre-event planning and post-event follow-up
- Platform and software fees for registration, CRM, and analytics
- Payment processing on ticket or merchandise sales
- Compliance and legal review for alcohol promotions
- Content production for follow-up sequences
- Pre-event marketing spend such as paid outreach and landing pages
Most B2B exhibitors under-count event cost by 30 to 50%, with staff time and opportunity cost being the two items most exhibitors skip, which inflates every ROI number produced. 73% of event marketers exclude marketing promotion costs from their event ROI calculations, causing reported true costs to run 40–60% higher than the figures they present.
Checkpoint: A total cost figure that would survive a CFO’s scrutiny.
Step 4: Choose An Attribution Rule
Objective: Decide how credit will be assigned before you see the results.
Action: Select one of three models based on your sales cycle.
| Attribution Model | Best For | Credit Distribution | Limitation |
|---|---|---|---|
| First-touch | Demand creation, short cycles | 100% to earliest touch | Ignores nurture touches |
| Last-touch | Short journeys, single-touch | 100% to final touch | Erases earlier influence |
| Multi-touch (position-based) | Longer cycles, multiple stakeholders | 40% first, 40% last, 20% middle | Requires clean data |
Around 67% of B2B marketing teams still credit only the final click before a conversion, ignoring every touchpoint that came before it. For most experiential programs with multiple attendee interactions, position-based multi-touch is the safest defensible default. The attribution policy about eligible touches, credit, timing, and missing data should be set before looking at which model gives the event the largest number.
Sourced and influenced revenue should be reported as nested tiers and kept separate. Every sourced opportunity is also influenced, so combining them double-counts the result.
Checkpoint: A written attribution policy signed by marketing, sales, and finance.
Step 5: Run The Measurement Cadence
Objective: Capture data at fixed checkpoints so ROI is calculated calmly and consistently.
Day 2 Checkpoint:
- Record total attendance and on-site data capture rate
- Note immediate feedback and any operational issues
- Confirm all attendee records are in the CRM
Day 14 Checkpoint:
- Measure registrations, opt-ins, and early conversion activity
- Calculate cost-per-registration and cost-per-opt-in
- Begin pipeline tracking for any opportunities created
Day 90 Checkpoint:
- Calculate total pipeline creation and influenced revenue
- Measure conversion to purchase and retention indicators
- Produce the final ROI number using the chosen attribution rule
The 2026 default attribution horizon for B2B events is 180 days, with a phased reporting rhythm of 30, 90, and 180 days. Consumer experiential programs usually have shorter purchase cycles, so a 90-day window captures most conversion activity. Companies that follow up with event leads within 24 hours generate 3x higher pipeline value than those waiting a week or more.
Checkpoint: A one-page report at each stage that leadership can read in 90 seconds.
Step 6: Measure Promotions For Events You Do Not Own
Objective: Track ROI for third-party retail tastings and partner venues where UTM tags cannot close the loop.
When a brand runs an activation inside a retailer or on-premise account, purchase tracking cannot run through owned systems. A depletion report shows what left the shelf, but it does not isolate what the activation caused.
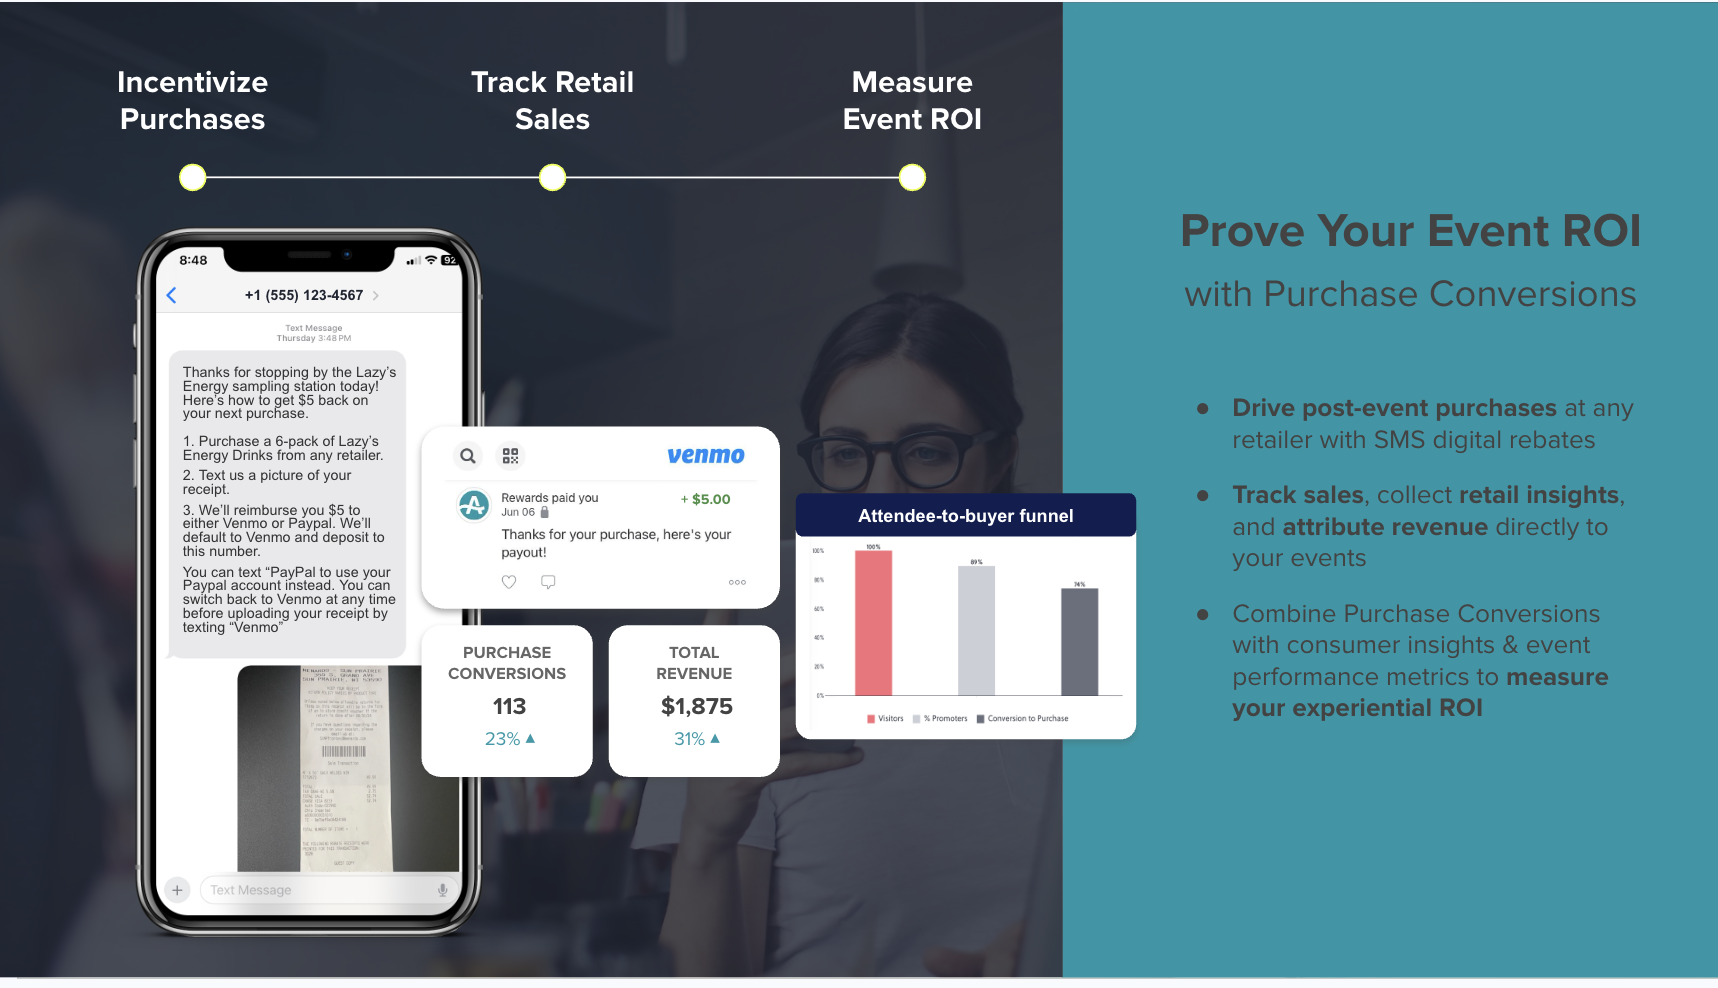
Receipt-based verification replaces UTM tracking in these environments. The mechanic works as follows.
- Guests scan a QR code and register on the spot via AnyRoad Live.
- They receive an SMS with a cashback rebate redeemable anywhere the product is sold.
- They buy the bottle, photograph the receipt, and text it back.
- AnyRoad’s AI reads the receipt, confirms the eligible SKU, and pays the rebate via Venmo or PayPal.
No POS integration is required because the mechanic runs on the receipt. This approach makes on-premise conversion tracking possible, since a rebate tied to an identifiable SKU on a bar tab can be measured directly. In a one-month ambassador tasting pilot with a single unnamed craft brand on a small dataset, 56% of records collected converted to a bottle purchase. This was an early pilot result, not a platform benchmark.

See this mechanic in action for your own retail activations.
Get A Demo Of Receipt-Verified Tracking
What Counts As A Good ROI For Event Promotions?
ROI benchmarks vary by event type because cost structures and return horizons differ. Use ranges that match the format and objective, then plug them into the six-step framework above.
- Ticketed consumer experiences: A 150%–300% direct return is a reasonable target when ticket sales offset costs. Measure against direct revenue and repeat visit rate. Absolut improved guest revenue per visit by 36% using AnyRoad data by tracking the full guest journey.
- Free brand-home tours: ROI is best expressed as cost-per-qualified-lead rather than a revenue multiple. Focus on opt-in rate, retail conversion, and club enrollment. Leiper's Fork Distillery raised tour prices by 33% using AnyRoad insights and recorded its third-highest grossing month ever despite conducting fewer tours.
- Trade shows: CEIR 2025 puts trade show return at $20.98 per dollar spent. Vendelux’s 2026 benchmarks define a healthy return on event investment (ROEI) as 3x to 5x event-sourced closed-won revenue at 180 days.
- Third-party retail activations: Use receipt-verified purchase conversion as the core metric. Success means a positive cost-per-verified-purchase compared to other acquisition channels. 85% of consumers engaged at the festival activations reported intent to purchase the mezcal brand's product post-event.
- Field marketing and CPG events: Treat uplift in purchase intent as a leading indicator. AnyRoad data from Conversate Collective's CPG beauty brand events showed 74% of guests were more likely to purchase after attending.
Leadership often asks for simple ROI thresholds, so align those questions with your tracking plan.
- Is 30% a good ROI? A 30% return can work for a mature program with low incremental cost. A first-time activation with heavy setup cost usually needs a higher return.
- Is 100% ROI breaking even? A 100% ROI figure means the investment doubled. Many event programs treat that level as breakeven once soft costs are included.
- What is a bad ROI? Any result below 100% with all costs counted, or any ROI calculated without soft costs and hidden fees, signals a weak outcome.
Common Tracking Mistakes To Avoid
Double-counting influenced revenue: Counting the same deal in both event-sourced and event-influenced totals inflates the number. As outlined in Step 4, keep sourced and influenced as nested tiers with separate reporting. Root cause: process gap.
Ignoring soft costs: Leaving out staff time inflates every ROI number. Calculate staff time as fully loaded hourly rate × hours spent. Root cause: poor data input.
Stopping measurement at the event: Most pipeline has not closed at Day 2, so the picture remains incomplete. Run the full 90-day window. Root cause: unclear ownership.
Using one attribution model across every channel: First-touch suits demand creation, while last-touch suits short cycles. Match the model to the sales cycle. Root cause: disconnected systems.
Treating a depletion report as proof: Depletion shows what left the shelf, but it does not tie directly to the activation. Use receipt-verified mechanics to connect activation to purchase. Root cause: disconnected systems.
Measuring Success: Signs Your Tracking Process Works
Strong tracking produces consistent, complete data that supports fast, confident reporting.
- Data completeness at registration: Track the percentage of registrants with full contact records.
- On-site capture rate: Track the percentage of attendees, not just bookers, who are captured. AnyRoad's FullView feature captures data from every attendee in a group, not just the person who made the booking. Campari Group has streamlined event management and integrated systems, with 48% of visitors converting to brand promoters after their experiences.
- Opt-in rate: Track the percentage of attendees who opted into marketing.
- Cost-per-registration: Watch whether this metric trends down across events.
- Conversion to purchase: Track the percentage of attendees who converted within 90 days.
- Reporting readiness: Confirm that a defensible ROI number can be produced at each checkpoint.
62% of organizations with a deeply integrated event tech stack are satisfied with their ability to prove ROI, versus only 37% of those without that integration. The difference comes from automated data flow rather than more complex analysis.

See how integrated tracking looks when AnyRoad feeds your CRM directly.
Advanced Tips For Better Event ROI Tracking
Automate data flow between the experience platform and CRM: Manual exports introduce errors and delays. Native integrations or webhooks remove the reconciliation step that causes most post-event data gaps. AnyRoad integrates with HubSpot, Salesforce, Klaviyo, and major POS and ERP systems such as SAP and NetSuite.
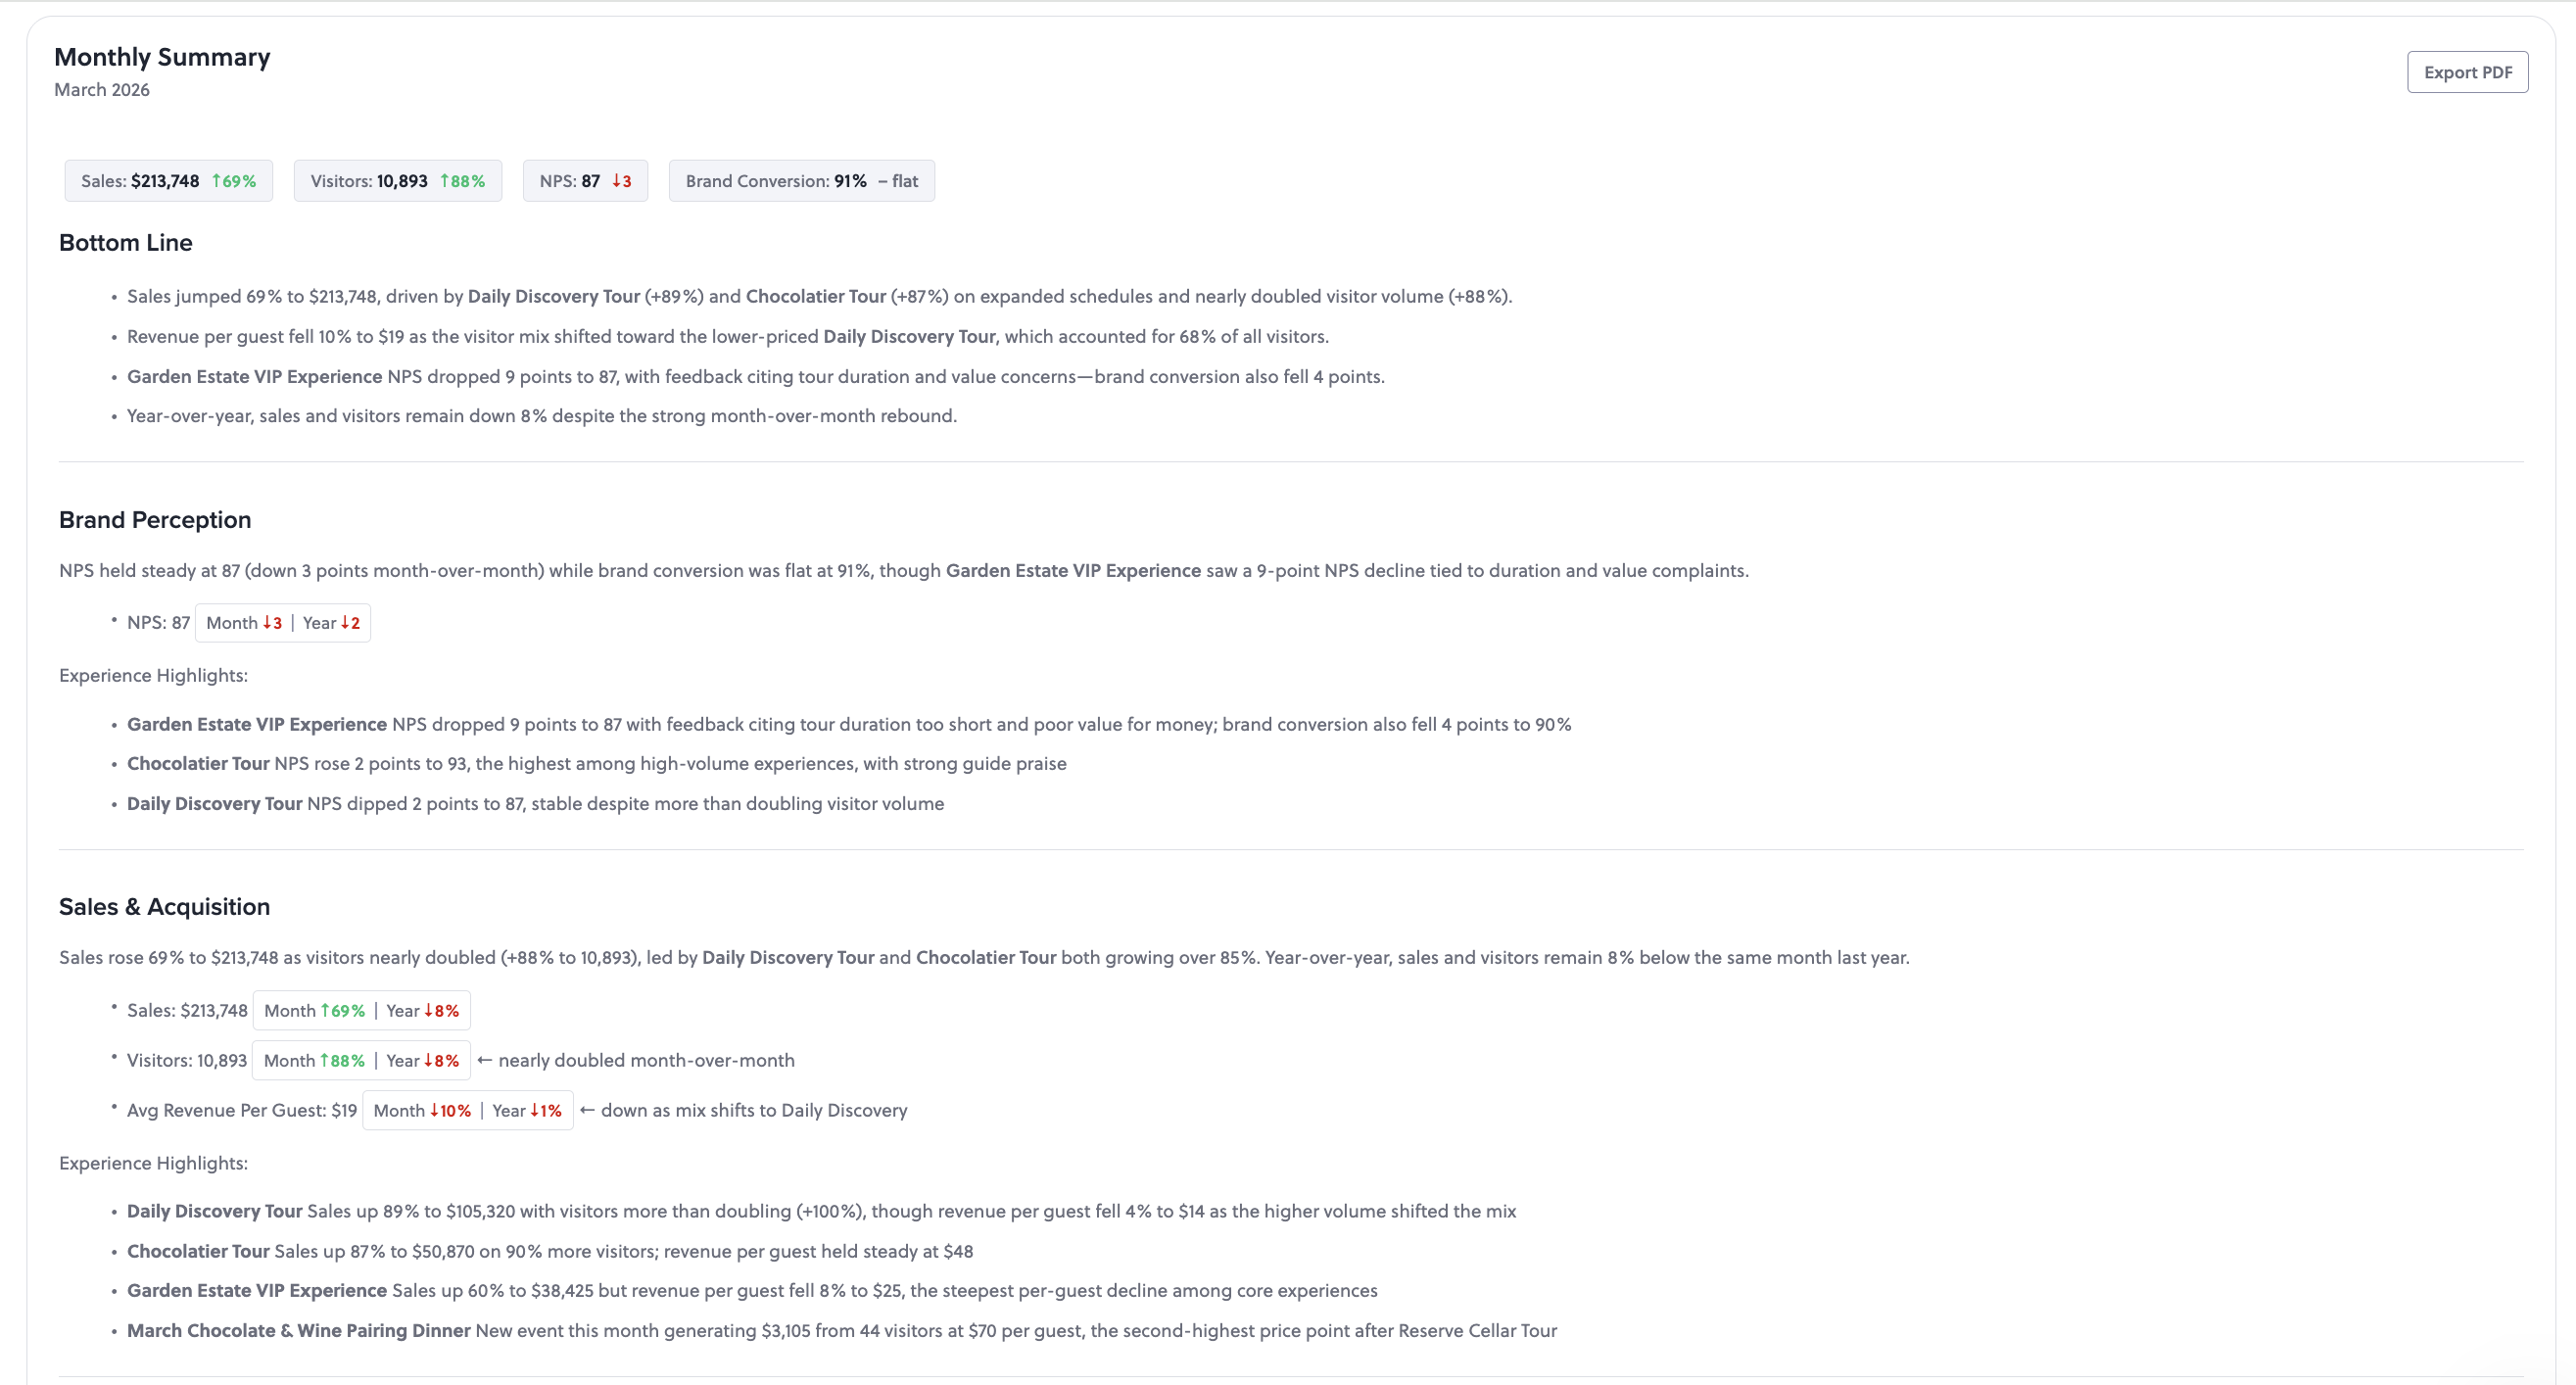
Segment follow-up by NPS, spend, and visit frequency: Attendees deliver different levels of value. AnyRoad's Atlas Insights measures brand affinity, NPS, and purchase intent and filters by experience, location, and demographics. Follow-up sequences then reach the right cohort with the right message. AnyRoad's AI-powered PinPoint feature analyzes open-text feedback into themes and sentiment, surfacing what drove promoters and where the experience needs improvement.
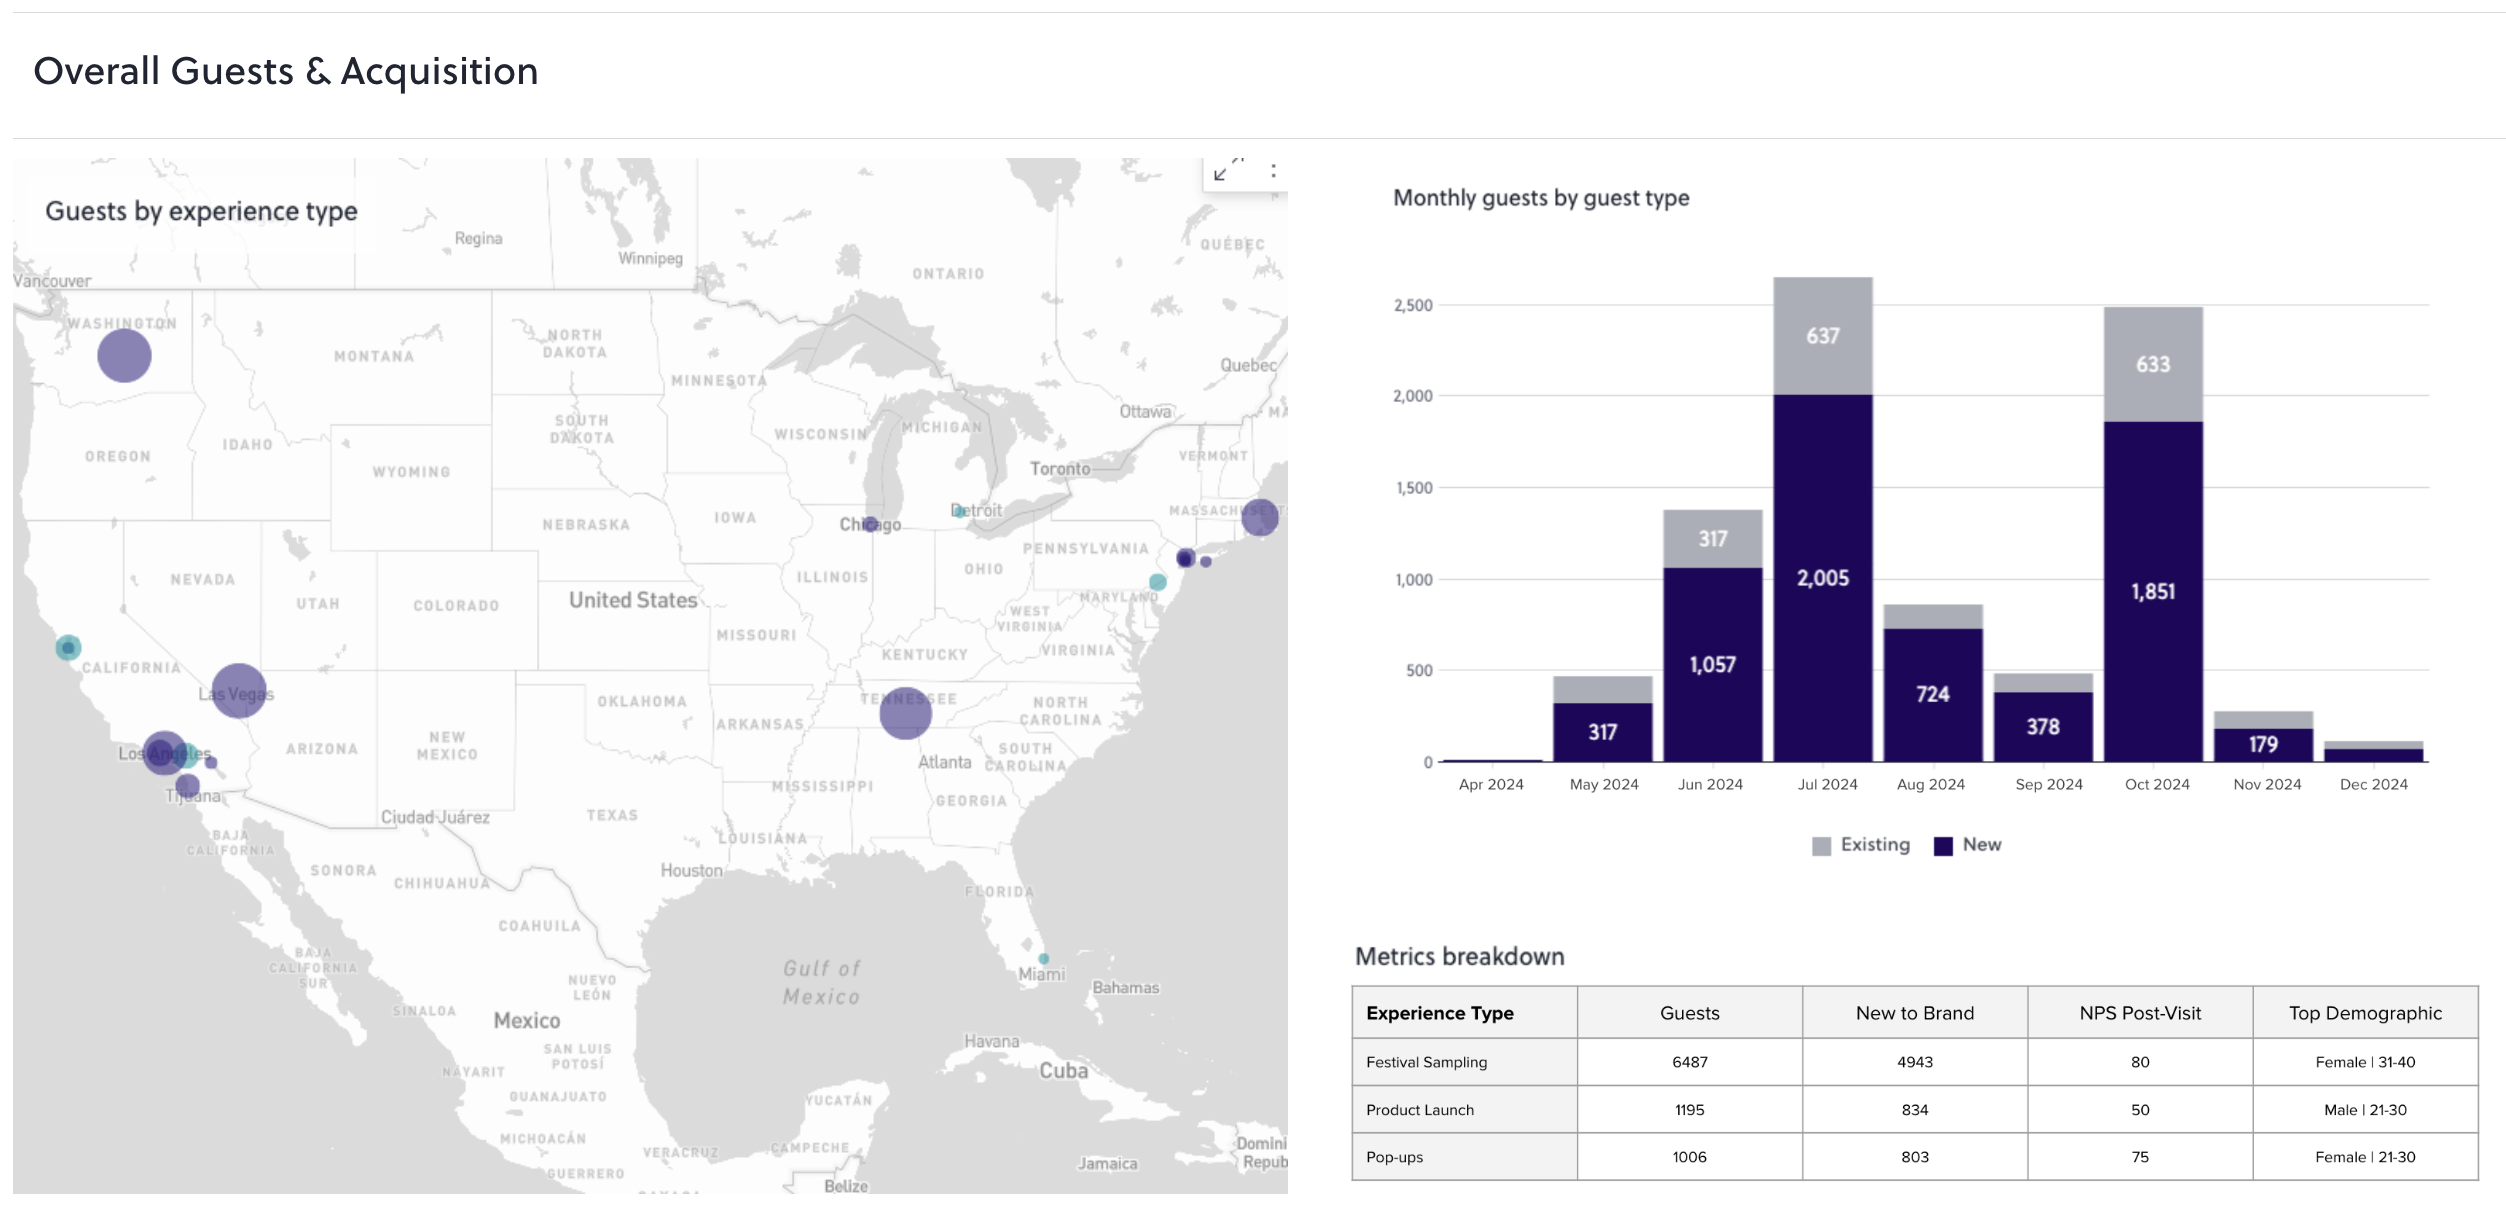
Standardize the tracking plan across multiple locations: When activations run across several markets, use the same UTM conventions and cost categories so performance can be compared. AnyRoad analytics showed that a historically under-targeted demographic was 40% more likely to drink whisky after visiting Johnnie Walker Princes Street. That insight depended on consistent data capture across thousands of visits.
Connect experiential data to retail sell-through: Receipt-verified mechanics and purchase conversion tools close the loop between experience and purchase. AnyRoad's Lifetime Loyalty suite sits on top of the same first-party experiential data. It includes Bottle Clubs, Premium Memberships, gamified purchase conversion tools, and managed CRM services, turning a single visit into recurring revenue.
Lifetime Loyalty results highlight the long-term impact of strong tracking. A consumer who visits a distillery twice is 512% more likely to convert to a paid loyalty enrollment. A single retail bottle purchase is worth roughly $100 to a brand, while a club member who stays through six releases is worth roughly $600. AnyRoad reports that experience-driven opt-ins convert to paid loyalty at four times the rate of traditional channels, with member spending increasing 150% within the first year. Heritage and craft brands including Heaven Hill Distillery, Nearest Green Distillery, Lux Row Distillers, Castle & Key, Catoctin Creek Distilling, and Tarnished Truth Distilling have adopted the Lifetime Loyalty platform.
Frequently Asked Questions About Event ROI Tracking
How Do I Track ROI For A Free Event?
Track opt-ins, retail conversion, and club enrollment instead of ticket revenue. Calculate cost-per-qualified-lead and compare it to other acquisition channels. A free brand-home tour that converts 20% of attendees into marketing opt-ins and 5% into club members may deliver a stronger cost-per-acquisition than paid digital campaigns, even without direct door revenue. Define these metrics before the event runs so the team knows what success means.
How Long After An Event Should I Keep Measuring?
Use a 90-day window at minimum for consumer experiential programs. For B2B events with longer sales cycles, extend to 180 days with preliminary results at 30 days and interim results at 90 days. Most pipeline has not closed within the first two weeks, and receipt-verified purchase conversions often continue for weeks after an activation ends.
What Is The Difference Between First-Touch And Last-Touch Attribution For Event Promotions?
First-touch assigns all credit to the earliest recorded touch, which helps identify the channel that introduced a new contact. Last-touch assigns credit to the final touch before conversion, which works for short journeys but removes earlier promotion influence. For most experiential programs where the event is one of several touchpoints, position-based multi-touch attribution at 40% first, 40% last, and 20% middle is a more defensible default. Agree on the attribution model before the event runs.
How Do I Measure An Activation In A Venue I Do Not Own?
Use the receipt-verified mechanic described in Step 6. Guests register on-site, receive a cashback rebate or sweepstakes entry by SMS, and submit a receipt that is verified against the eligible SKU. The mechanic runs on the receipt itself, so it works in any retail or on-premise account and creates a first-party record tied to a verified purchase.
Who Should Own The Tracking Plan?
Assign a named owner from marketing or event operations, with sign-off from finance on cost categories and from sales on attribution rules. Ownership gaps often cause measurement cadences to break down, because no one feels responsible for the Day 90 report. The tracking plan document should name the owner, the checkpoints, and the stakeholders who receive each report before the event launches.
Conclusion: Make Your Event ROI Number Defensible
The measurement lifecycle for event promotions follows a consistent structure. Define the goal, build the tracking plan, capture total cost across hard costs, soft costs, and hidden fees, choose an attribution rule before seeing results, run the 90-day cadence at fixed checkpoints, and use receipt-verified mechanics for events the brand does not own.
Structured execution and clean data make the number defensible to leadership. A better formula cannot compensate for incomplete inputs.
AnyRoad captures first-party data across the entire guest journey before, during, and after the experience and connects experiential spend to receipt-verified retail purchases. From FullView on-site data capture to Atlas Insights analytics to Purchase Conversion Tools that close the loop between activation and bottle sold, the platform supports the full measurement lifecycle described in this guide.
Schedule A Personalized AnyRoad Demo