


Written by: Bryan Grobstein, Vice President, Global Revenue, AnyRoad
Key Takeaways
- Shopper marketing KPIs fall into three tiers: outcome, diagnostic, and leading indicators. Together they show whether activations created incremental demand.
- Incremental sales lift and incremental gross profit act as the North Star metrics. Total sales and platform ROAS often capture non-incremental purchases and can inflate results.
- Diagnostic KPIs such as new-to-brand rate, basket attachment, and repeat purchase rate reveal whether the proposition resonated and whether trial turned into loyalty.
- Leading execution KPIs like display compliance, planogram compliance, and out-of-stock rate confirm the program was delivered before teams judge sales outcomes.
- AnyRoad closes the attribution gap between experiential touchpoints and retail sell-through with receipt-verified purchase conversion and first-party data that syndicated sources cannot provide.
See how AnyRoad connects experiences to incremental sales. Schedule a demo.
Why Shopper Marketing KPIs Matter Now
CFOs are scrutinizing every line of the marketing budget at a moment when global commerce media reached $178.2 billion in 2025, overtaking total television revenue for the first time. Retail media has become a primary activation channel for CPG and spirits brands, and US retail media spend is on pace to reach $107.6 billion in 2026, nearly triple where it stood five years ago. At the same time, only 53% of CMOs believe their retail media networks provide adequate measurement and attribution to support reliable incrementality measurement.
The attribution gap between a digital impression and a verified in-store purchase has never been wider. Closed-loop retail media measurement only covers activity within a single retailer's tracked environment, and attribution data stops once a purchase happens outside that environment. For spirits and CPG brands running ambassador tastings, distillery visits, and festival activations, the gap is even more acute, because those touchpoints have historically produced only a depletion report.
Shopper marketing teams are drowning in data from NielsenIQ and Circana POS panels, retail media network dashboards, and field reporting tools. What they lack is a hierarchy that tells a practitioner which number to trust, in what order, and how to respond when the numbers conflict.
Get a demo of receipt-verified purchase tracking. Schedule a demo.
The Shopper Marketing KPI Hierarchy And The North Star Principle
The governing rule of the hierarchy is simple: execution KPIs exist to explain sales KPIs, and teams should not report them as equals. A display compliance score, for example, is only meaningful when it sets up a conversation about why incremental lift was or was not achieved. When both numbers appear at the same level of importance, the causal chain becomes unclear and leadership confidence erodes.
Incremental sales is the North Star. Total sales during a promotional window almost always look strong because they include baseline demand that would have occurred regardless of the activation. Most companies measure success by total sales volume during a promotion window, which looks positive but says nothing about whether the promotion created demand or borrowed it from the following week. Incremental sales isolates the causal contribution of the activation by comparing promoted results against a non-promotional baseline.
ROAS alone creates a similar trap. ROAS is an efficiency metric: it tells a brand where its budget went, not what that budget created. A channel can show a 6x platform ROAS while being nearly non-incremental, capturing credit for purchases that were already going to happen. Incremental ROAS, defined as incremental revenue divided by ad spend, separates caused revenue from coincident revenue.
The hierarchy flows as follows. In-store execution KPIs are leading indicators that confirm the program was delivered. Retail media KPIs explain reach and efficiency. Diagnostic KPIs explain whether the proposition resonated with shoppers. Outcome KPIs, incremental sales and incremental gross profit, deliver the verdict. Experiential and brand-home KPIs close the attribution gap that syndicated data cannot, connecting a tasting room visit or an ambassador interaction to a verified retail purchase.
To cut through metric overload, teams need this hierarchy to rank metrics by their causal role.
The KPI Tiers: What To Measure And Why
Outcome KPIs: Incremental Sales Lift And Incremental Gross Profit
Incremental sales lift is calculated by comparing sales in activated stores or markets against a non-promotional baseline. The standard formula:
Incremental Units = Total Units Sold During Activation − Expected Baseline Units
The baseline comes from a non-promotional reference period, using at least 8–12 weeks of pre-promotion data adjusted for seasonality. For retail activations, use an unpromoted baseline from a four-week non-promo period in the same store and SKU. Then compare activation-period sales against expected baseline sales. This approach avoids conflating the activation's effect with seasonality, competitor promotions, and distribution changes.
Incremental revenue equals incremental units multiplied by the net realized selling price. Incremental gross profit subtracts cost of goods sold and total activation cost from that figure. Trade promotion ROI is calculated by dividing incremental gross profit by total trade spend; if incremental gross profit is less than the promotion's cost, the ROI is negative. Reporting incremental revenue without accounting for margin and activation cost inflates the program's contribution to the business.
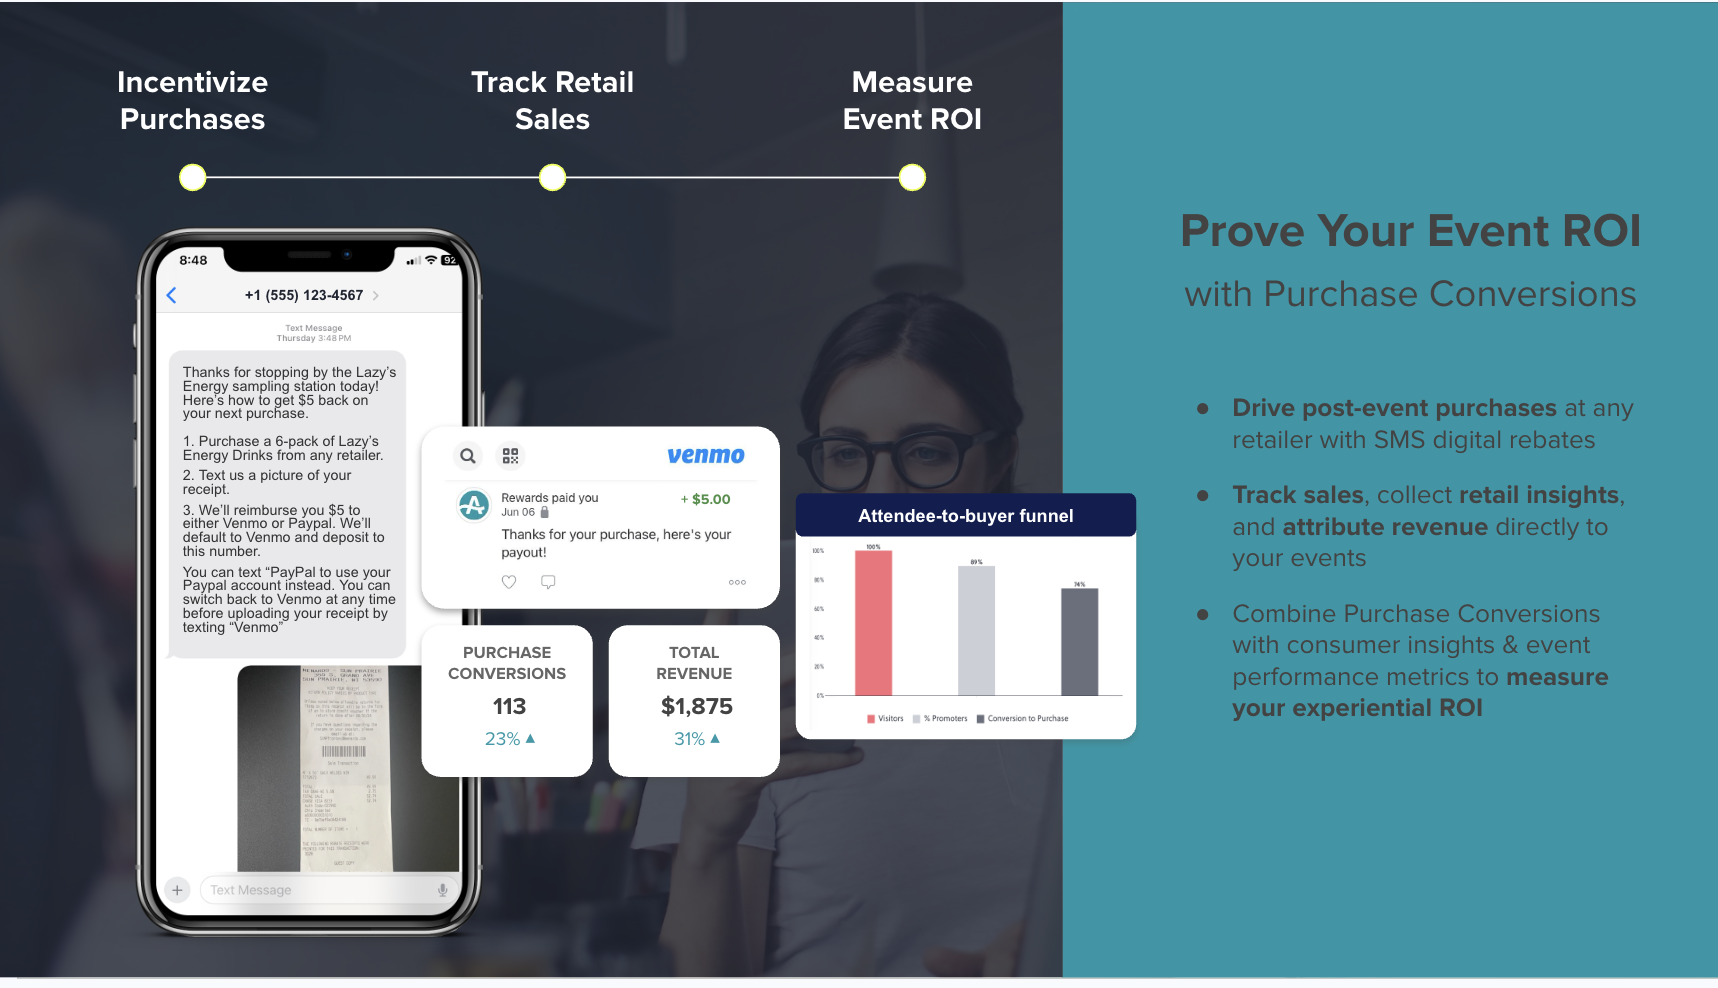
AnyRoad's Purchase Conversion Tools, including cashback rebates, punch card experiences, and sweepstakes entries sent via SMS, connect experiential spend to retail sell-through by requiring receipt-verified purchase. A consumer who attends a tasting receives an SMS with a cashback rebate redeemable anywhere the product is sold. They photograph the receipt and text it back. AnyRoad's AI reads the receipt, confirms the eligible SKU, and pays the rebate via Venmo or PayPal. This mechanic runs on the receipt and requires no POS integration. As a result, incremental sales become measurable at the activation level, including in on-premise and third-party retail accounts where a depletion report was previously the only available signal.
Diagnostic KPIs: New-To-Brand Rate, Basket Attachment, Repeat Purchase Rate, And Promotion Redemption
Diagnostic KPIs explain whether the proposition worked. A strong incremental lift number with a low new-to-brand rate suggests the activation primarily served existing buyers, which supports retention but not household penetration growth. A high new-to-brand rate with low repeat purchase rate suggests the product or experience failed to convert trial into loyalty.
New-to-brand definitions in retail media depend on the lookback window used, such as whether a shopper has purchased from the brand within the past 6 or 12 months. Platforms should make these definitions clear to build advertiser trust. Basket attachment measures whether the brand's product appeared alongside complementary items, which indicates cross-category influence. Repeat purchase rate, tracked at 30, 60, and 90 days post-activation, distinguishes genuine demand creation from pantry loading.
Promotion lift and redemption rates, including digital coupon clip-to-redeem, cashback redemption, and sweepstakes entry, form the diagnostic bridge between an activation and a verified purchase. Coupon redemption benchmarks are 1–3% for paper coupons, 5–15% for digital coupons, and 20–40% for app-based coupons. A redemption rate significantly below the category benchmark warrants an audit of the offer structure, the redemption friction, and the audience match before a creative rethink.
Leading And In-Store Execution KPIs: Display Compliance, Planogram Compliance, Out-Of-Stock Rate, On-Time Execution
A sales miss should trigger an execution audit before a creative rethink. NielsenIQ research shows that in-store execution failures, such as wrong placement and missing displays, drive low promotion conversion rates even on well-funded promotions. Display compliance, planogram compliance, out-of-stock rate, and on-time execution act as leading indicators because they precede the sales outcome and explain whether the program was delivered as designed.
Out-of-stock rate is particularly consequential. A retail media campaign that drives traffic to a shelf where the product is unavailable damages brand equity and fails to create incremental sales. Standard retail media reporting captures only the bookends of the shopper journey, the impression and the transaction, and misses everything in between. That gap inflates exposure estimates and masks underperforming placements. Execution KPIs fill that gap.
Retail Media KPIs: CTR, CPA, Add-To-Cart, New-To-Brand, Attributed Store Sales, Incremental ROAS
Retail media KPIs explain reach and efficiency, and their interpretation depends on the incremental ROAS distinction. When practitioners run incrementality studies, they often see a clear gap between attributed ROAS and iROAS, where attributed ROAS suggests a campaign is wildly successful while iROAS reveals a more modest but accurate incremental lift. When independent incrementality tests run, validated returns typically land 30 to 60% below the last-click ROAS networks report.
CTR and add-to-cart function as activity metrics. They confirm delivery and engagement but do not prove causation. Attributed store sales connect digital exposure to in-store purchase through loyalty card matching, but coverage varies significantly by retailer and category, so for most brands a substantial share of physical store sales remains unattributed to digital exposure.
AnyRoad's cashback rebate mechanic runs on the receipt and requires no POS integration, which makes on-premise and third-party retail conversion tracking possible at all. A rebate tied to an identifiable SKU on a bar tab is measurable in a way a depletion report never is. It also produces a first-party record that teams can report alongside retail media KPIs to give leadership a complete picture of activation-driven sell-through.
Experiential And Brand-Home KPIs: Visit Frequency, NPS, Enrollment Rate, Receipt-Verified Purchase Conversion, Second-Visit Signal
This tier closes the attribution gap that syndicated data cannot. Experiential and brand-home KPIs connect the in-person touchpoint to the retail purchase, and they ladder directly into the outcome tier of the hierarchy.
AnyRoad captures visit frequency, NPS, enrollment rate, receipt-verified purchase conversion, and the second-visit signal at the activation level. Each of these feeds into the broader shopper KPI hierarchy. NPS measures whether the experience created a promoter. Enrollment rate measures whether the visit converted to a paid loyalty relationship. Receipt-verified purchase conversion, tracked through AnyRoad's cashback rebate mechanic, measures whether the experience drove a bottle off a shelf.
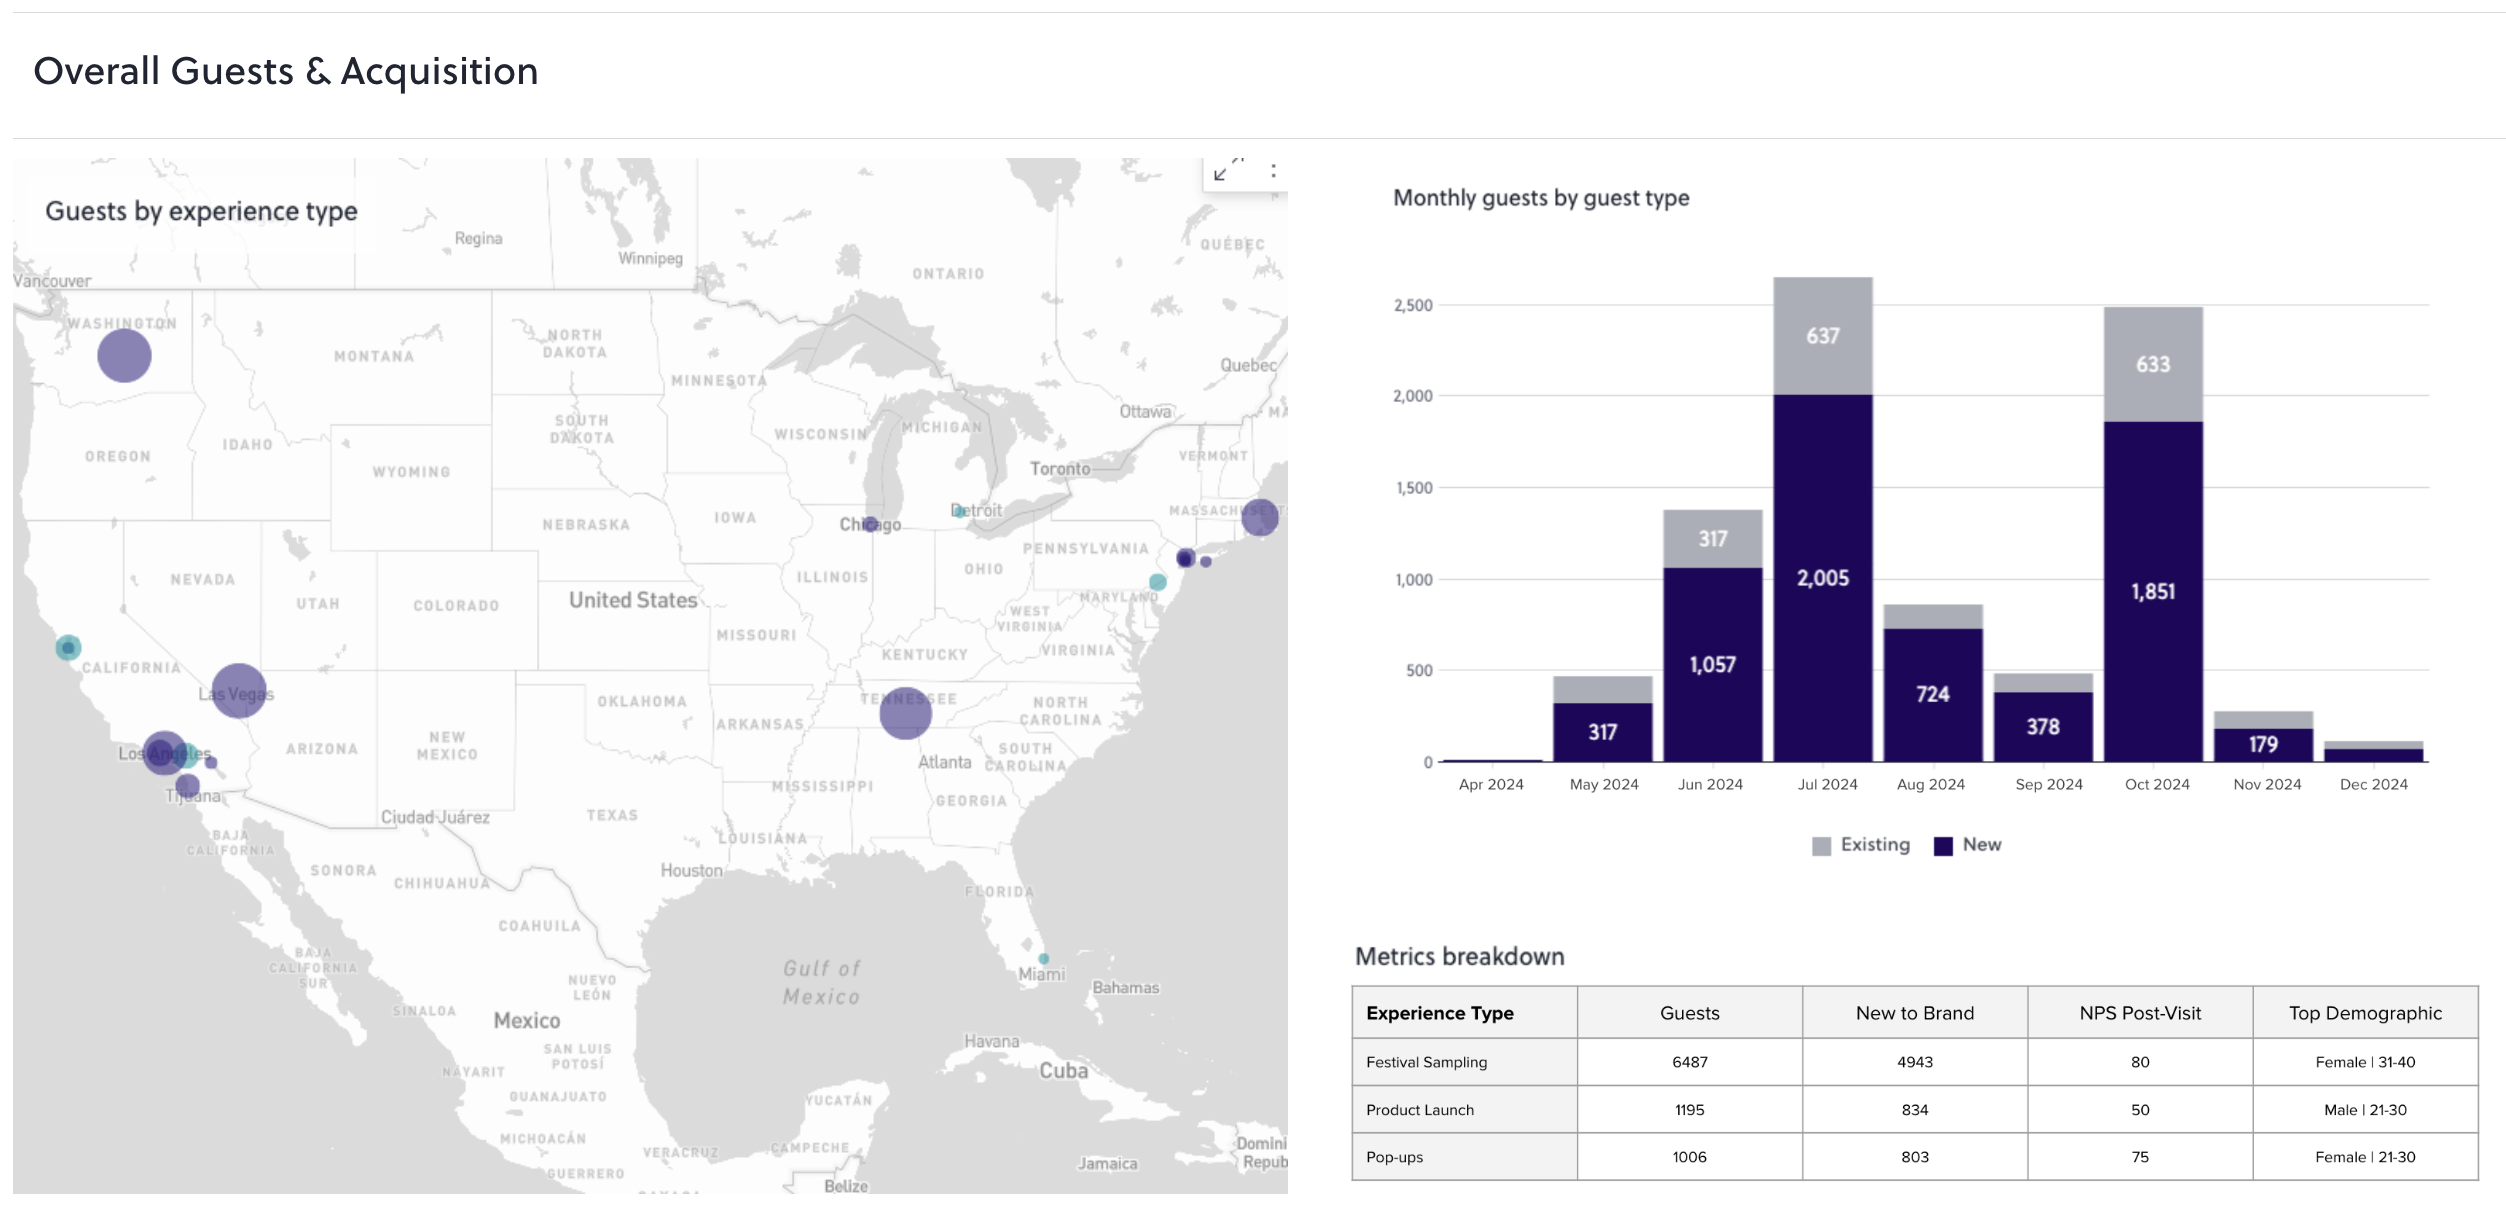
The second-visit signal is the most powerful leading indicator in the experiential tier. A consumer who visits a distillery twice is 512% more likely to convert into a paid loyalty enrollment, according to AnyRoad data. That signal, surfaced through AnyRoad's Atlas Insights analytics dashboard, tells a brand manager exactly which guests to prioritize for an enrollment conversation before they leave the tasting room.

AnyRoad's PinPoint AI-powered feedback analysis turns open-text guest survey responses into themes and sentiment drivers. This capability enables brands to identify which elements of the experience create promoters and which create friction. At Johnnie Walker Princes Street, Diageo measured a 16-point NPS increase from pre-visit to post-visit using AnyRoad analytics, and found that a historically under-targeted demographic was 40% more likely to drink whisky after visiting. That behavioral shift would not appear in syndicated panel data.

Absolut Home increased average revenue per guest by 36% since 2018 and maintained a consistent brand conversion score of 85% post-event, with a visitor NPS of 75. Campari Group has reported streamlined event management powered by AnyRoad, though specific per-customer spend and promoter-conversion figures are not publicly documented.
At the festival level, an artisanal mezcal brand running activations at III Points and Portola achieved 85% post-event purchase intent and a 75% lift in purchase intent post-experience, with AnyRoad's automated reporting saving significant time. For a CPG beauty brand, AnyRoad data showed that 74% of event guests were more likely to purchase the brand's products after attending.
Experience-driven opt-ins convert to paid loyalty at four times the rate of traditional channels, with member spending increasing 150% within the first year, according to AnyRoad's reporting from its Lifetime Loyalty launch. Brands including Heaven Hill Distillery, Nearest Green Distillery, Lux Row Distillers, Castle & Key, Catoctin Creek Distilling, and Tarnished Truth Distilling have adopted the platform.
Even with the right KPIs defined, putting the hierarchy into practice surfaces several structural tensions.
Strategic Considerations And Trade-Offs
Building a complete shopper KPI hierarchy requires resolving several structural tensions before the first campaign readout.
Data ownership is the first tension. Syndicated data from NielsenIQ and Circana is licensed, not owned, and Circana's syndicated extracts carry a reporting lag of a week or more after the selling week closes, with revisions trickling in afterward. Retail media network data is controlled by the retailer. First-party experiential data, collected through AnyRoad's platform, is owned by the brand and available in real time, which creates a structural advantage in budget conversations.
Integration between experiential, retail media, and POS data is the second tension. Combining syndicated, retailer, and panel datasets is challenging because categories, product hierarchies, and retailer definitions do not always align. Teams must manually reconcile differences in a time-intensive, ongoing process. Brands that connect AnyRoad's first-party experiential data to their CRM, CDP, and POS feeds through the platform's native integrations, including HubSpot, Salesforce, and Klaviyo, reduce that reconciliation burden significantly.
Cross-functional ownership is the third tension. Retail media budget ownership is fragmented: brand marketing holds it at 71% of organizations, ecommerce at 54%, product marketing at 46%, while shopper marketing's share fell from 37% in 2021 to 11%. A KPI hierarchy without a clear owner for each tier will produce conflicting readouts across teams. Assigning outcome KPIs to brand leadership, diagnostic KPIs to shopper marketing, and execution KPIs to field teams creates accountability without duplication.
The trade-off between measurement rigor and reporting speed is real. A geo holdout test that produces a statistically valid incrementality estimate takes weeks to design and execute. A depletion report is available the next morning. A tiered measurement cadence balances these pressures: execution KPIs reported weekly, diagnostic KPIs reported monthly, and outcome KPIs validated against a control group at the campaign level.
Implementation And Readiness Guidance
A shopper marketing scorecard should contain no more than seven to ten KPIs across all tiers. Tracking dozens of metrics can create an impressive dashboard but often obscures the findings that matter. Organize the scorecard by tier, with one owner per tier and a defined reporting cadence for each.
Measurement maturity progresses logically from execution to outcome. Phase one establishes baseline execution tracking with display compliance, out-of-stock rate, and on-time execution. Phase two adds diagnostic KPIs such as new-to-brand rate, repeat purchase rate, and promotion redemption. Phase three adds incremental sales lift against a matched control group. Phase four integrates experiential data, including NPS, enrollment rate, and receipt-verified purchase conversion, to close the attribution gap.
When presenting a campaign readout to leadership, lead with the outcome tier. State the incremental sales lift, the incremental gross profit, and the iROAS. Then use the diagnostic and execution tiers to explain the result. A readout that leads with impressions and display compliance scores and buries incremental lift at the end signals that the team does not trust its own outcome number, which quickly undermines budget requests.
How AnyRoad Supports The KPI Hierarchy
AnyRoad's Lifetime Loyalty suite, which includes Bottle Clubs, Premium Memberships, and managed CRM services, turns a one-time visit into recurring, measurable revenue. A single retail bottle purchase is worth roughly $100 to a brand. A club member who stays through six releases is worth roughly $600. The platform is delivered as technology plus white-glove service by spirits industry operators who coach on-site staff, set up the enrollment experience, and handle the operational lift brands would otherwise have to staff internally. As a result, incremental revenue from a tasting room visit extends across a measurable membership lifecycle rather than stopping at a single bottle.
Turn tasting room visits into recurring revenue. Schedule a demo.
KPIs That Lie
Several common measurement practices produce numbers that look credible but actively mislead budget decisions.
ROAS myopia is the most widespread. Platform-reported ROAS credits every sale that occurred during a campaign window to the campaign, regardless of whether the campaign caused it. In a worked example, a channel spends $100,000 and reports $500,000 in revenue, showing a platform ROAS of 5.0. A holdout test reveals only $300,000 is truly incremental, yielding an iROAS of 3.0. The platform overstated ROAS by 67%. Treating platform ROAS as an incrementality answer will point budget in the wrong direction.
Pantry loading and the post-promotion dip are the trade promotion equivalent. Post-promotional dips must be accounted for: if sales drop 50% below baseline during the two weeks following an activation, the campaign cannibalized existing demand rather than acquiring new consumers. A post-promotion sales dip of more than 15% below pre-promotion baseline indicates shoppers stockpiled product and the promotion borrowed future sales at a discount rather than growing the base.
Total-sales-versus-incremental confusion stems from definitions rather than data. CPG trade spend decisions made without an incremental baseline overstate returns by 30% or more. Over 70% of trade promotions fail to break even on incremental profit, and only 20% of trade promotions are profitable. Those findings remain invisible when success is defined as total promoted volume.
The attribution gap between digital exposure and store sales is the structural failure mode that no single data source resolves on its own. Around 70% of UK retail spending still happens in physical shops, so a retail media test that captures only online sales measures less than a third of the picture. For spirits and CPG brands, the gap is compounded by the fact that experiential activations, including tastings, distillery visits, and festival appearances, have no native connection to retail POS data unless a receipt-verification mechanic is in place.
Practical Examples And Use Cases
Three scenarios illustrate how the hierarchy works in practice.
Ambassador tasting inside a third-party retailer. An ambassador runs a four-hour tasting at a Total Wine location. Without a digital touchpoint, the only available metric is a depletion report. With AnyRoad Live, guests scan a QR code and register on the spot. Each registrant receives an SMS with a cashback rebate. Receipt-verified purchases are tracked at the SKU level, producing an incremental units figure, a cost per incremental buyer, and a receipt-verified conversion rate. All of this happens without requiring the retailer to integrate a POS system. In an early one-month pilot with a craft brand, 56% of records collected converted to a bottle purchase, a small-sample result that illustrates the mechanic's potential rather than a platform benchmark.

Distillery visit-to-enrollment path. A consumer visits a distillery for the first time. AnyRoad captures NPS, purchase intent, and visit data. The consumer returns for a second visit, triggering the conversion signal mentioned earlier, and a coached tour guide makes the enrollment pitch for the brand's Bottle Club. The consumer enrolls on-site, the highest-converting channel. Enrollment rate, second-visit frequency, and subsequent receipt-verified purchases all feed into the experiential KPI tier and ladder up to incremental gross profit in the outcome tier.
Retail media campaign measured against incremental ROAS. In Stella's illustrative geo holdout example, a brand spends $50,000 on Google Ads, Google reports $250,000 in attributed revenue, and the geo holdout finds only $100,000 was incremental, giving an iROAS of 2x. The diagnostic tier shows strong new-to-brand rate but low repeat purchase at 30 days, which points to a product trial problem rather than a media efficiency problem. Execution KPIs such as display compliance help confirm whether the program was delivered as designed. The readout to leadership leads with the iROAS, explains the new-to-brand opportunity, and recommends a post-trial sampling mechanic to address the repeat purchase gap.
Frequently Asked Questions
What Are The 5 Key Performance Indicators In Shopper Marketing?
The five most consequential shopper marketing KPIs, organized by the hierarchy, are:
- Incremental sales lift, the outcome KPI that proves a program created demand rather than borrowing it.
- New-to-brand rate, the diagnostic KPI that confirms whether the activation reached the right audience.
- Display compliance, the leading indicator that confirms the program was delivered.
- Incremental ROAS, the retail media KPI that separates caused revenue from coincident revenue.
- Receipt-verified purchase conversion, the experiential KPI that closes the attribution gap between a tasting or visit and a bottle leaving a shelf.
Together, these five KPIs span all tiers of the hierarchy and give leadership a complete picture of activation performance.
How Do You Measure Incremental Sales Lift?
Incremental sales lift compares sales in activated stores or markets against a non-promotional baseline, as described in the Outcome KPIs section. Teams calculate incremental units by subtracting expected baseline units from total units sold during the activation. The result should be paired with a control group, such as stores or markets where the activation did not run, to separate the activation's effect from market trends, competitor promotions, and distribution changes. Incremental revenue equals incremental units multiplied by the net realized selling price, and incremental gross profit subtracts cost of goods sold and total activation cost from incremental revenue. An 8-week post-promotion tracking window is the standard for detecting pantry loading and confirming durable lift; 4 weeks usually misses the back half of the dip, while 12 weeks or more introduces too much noise from competitor activity and category seasonality.
What Is The Difference Between Leading And Lagging Shopper Marketing KPIs?
Leading KPIs are measurable before or during an activation and predict whether the outcome KPIs will be achieved. Display compliance, planogram compliance, out-of-stock rate, and on-time execution are leading indicators because they confirm the program was delivered as designed, which is a prerequisite for any sales outcome. Lagging KPIs are measured after the activation window closes and reflect the business result. Incremental sales lift, incremental gross profit, repeat purchase rate, and new-to-brand rate are lagging indicators because they require a selling period and a post-promotion tracking window to calculate. The diagnostic value of the hierarchy comes from reading leading and lagging KPIs together, so a lagging miss in incremental lift should trigger an audit of leading execution KPIs before any conclusion about creative or proposition effectiveness.
How Many KPIs Should You Actually Track?
A shopper marketing scorecard should contain no more than seven to ten KPIs across all tiers, as noted in the implementation guidance. The practical limit is determined by what can be owned, reported, and acted on within a single campaign cycle. Each KPI should have a defined owner, a numeric success threshold set before the campaign launches, and a reporting cadence matched to the tier, with weekly reporting for execution KPIs, monthly reporting for diagnostic KPIs, and per-campaign reporting for outcome KPIs.
Measure incremental lift with receipt-verified data. Schedule a demo.