


Written by: Bryan Grobstein, Vice President, Global Revenue, AnyRoad | Last updated: October 21, 2026
Key Takeaways
- Attributed sales trace purchases to an activation via QR codes or promo codes, while incremental sales prove purchases would not have happened without the activation.
- Match attribution methods to activation type: receipt-verified rebates work best for third-party retail tastings, while CRM matching suits owned brand experiences.
- Disclose the attribution window and baseline before the activation runs so finance teams can audit and defend the results.
- Receipt-verified rebates capture verified purchases in accounts you do not own without requiring POS integration from retailers or bars.
- AnyRoad captures first-party data from every attendee, connects experiences to receipt-verified purchases without POS integration, and reports the ROI of each activation in one platform.
Attributed Sales Vs. Incremental Sales: The Core Distinction
Attributed sales are purchases you can trace back to an activation through an identifier such as a QR code, promo code, or matched customer record. Incremental sales are the purchases that would not have happened without the activation, which requires a comparison against a baseline or control group. Keep traced sales and caused sales distinct in every report.
Conflating the two is the most common reason experiential reporting gets challenged in a finance review. The IAB and IAB Europe state in their joint incrementality guidelines: “Incrementality differs from attribution and ROAS: those methods show what happened, not whether marketing caused the result.” A QR code scan shows that a consumer took an action after the activation. It does not show whether they would have bought the bottle anyway.

A well-run incrementality test will almost always produce a smaller number than attributed reporting. That is the point of the test. The smaller number is more defensible because it accounts for baseline demand, the purchases that were going to happen regardless of the activation.
Choosing An Attribution Method For Your Activation Type
The method you choose depends on whether you want to know what the activation traced to or what it caused. Each method answers only one of those questions. Each also carries a specific blind spot.
- QR Codes And Promo Codes: Prove that a traceable action followed the activation, but capture only the fraction of attendees who act immediately and say nothing about later purchases.
- CRM And Loyalty Matching: Show which known customers attended and what they bought afterward, but cover only identified customers and cannot see purchases in accounts the brand does not own.
- Before-And-After Comparison: Shows whether sales moved across the activation window, but mixes the activation effect with seasonality, promotions, weather, and other concurrent changes.
- Matched-Market Or Holdout Testing: Produces causal lift against a credible counterfactual, but requires cost, statistical power, spillover controls, and a holdout design before the campaign runs. BCG research identifies holdout contamination as a key pitfall: holdout customers often receive communications through channels the marketing system does not control, such as branch staff calls, retail associate promotions, and parallel paid media, and every uncontrolled touchpoint dilutes the holdout and biases measurement toward underestimating program impact.
- Marketing Mix Modeling (MMM): Estimates channel-level contribution across the full media plan and supports budget allocation, but infers the counterfactual from historical variation and struggles with correlated or low-variation channels and needs experimental calibration to be trusted.
Match the method to the activation type using this framework:
- Sampling Events And Ambassador Tastings Inside Third-Party Retail: Use receipt-verified rebate or code capture, plus a holdout where feasible. This combination produces a verified purchase count without asking the retailer to share EPOS data.
- Owned Brand-Home Tours And Pop-Ups: Use CRM and loyalty matching plus before-and-after comparison. You control the guest record and can see downstream purchase behavior for identified customers.
- Sustained Sponsorships And Multi-Market Programs: Use matched-market testing or MMM. The beverage-alcohol playbook recommends pairing markets on distribution depth, baseline depletion trends, seasonality, and competitive presence, then holding out roughly 20% to 30% of matched markets and reading results over 8 to 12 weeks.
Methods combine. A sampling program can use receipt-verified rebates for tracing and a geo holdout for incrementality. The decision framework is about the question being asked and not about which vendor sells the measurement.
How To Measure Incremental Sales From An Activation
A difference-in-differences design is the most practical starting point for most activation teams. Select treated markets where the activation runs and matched control markets where it does not. Measure the outcome, such as velocity, depletions, or verified purchases, in both groups before and after the activation window. The incremental lift is the difference in the change between groups: (treated after − treated before) − (control after − control before). This is illustrative, because the actual estimate depends on market selection, sample size, and statistical power.
Set the attribution window by the category’s purchase cycle, not by an arbitrary calendar period. A proper holdout requires a defined group withheld from the campaign while it runs concurrently, rather than a comparison against a prior period, because time-period comparisons mix the campaign effect with seasonality, promotions, weather, and other changes. Set the baseline before the activation runs. Retrofitting the baseline afterward produces a much weaker answer.
A named example with a disclosed method: a Grocery TV meta-analysis of 16 CPG sales lift studies found an average 14% incremental sales lift and an average 4.7x return on ad spend, measured via regression analysis of test stores versus control stores. That figure is a benchmark for in-store retail media, not a guarantee for any single activation, and the underlying studies are not individually disclosed.
Two honest caveats apply to every incrementality number. Revenue-to-cost is not profit ROI, because it does not account for margin, cost of goods, or promotional spend on the rebate itself. A platform measuring its own lift has an obvious conflict of interest; ask whether outcomes measurement is independently accredited. Those caveats matter most in the accounts a brand does not control, where the hardest attribution problem in CPG and alcohol sits: proving that an ambassador tasting inside a Total Wine or an on-premise pour at a bar actually moved product.
Tracking Purchases In Accounts You Don’t Own: Receipt-Verified Rebates
The hardest attribution problem in CPG and alcohol is proving that an ambassador tasting inside a Total Wine or an on-premise pour at a bar account actually moved product. Depletion reports show units moved by account, but they do not connect a specific activation to a specific purchase. Receipt-verified rebates close that gap without asking any retailer or bar to integrate a POS system.
AnyRoad’s mechanic works as follows. AnyRoad Live captures the guest at the activation via QR registration. An SMS delivers a cashback rebate redeemable anywhere the product is sold. The consumer photographs the receipt and texts it back. AnyRoad’s AI reads the receipt, confirms the eligible SKU, and pays out via Venmo or PayPal. The entire flow runs on the receipt, which means it works in any account at scale.
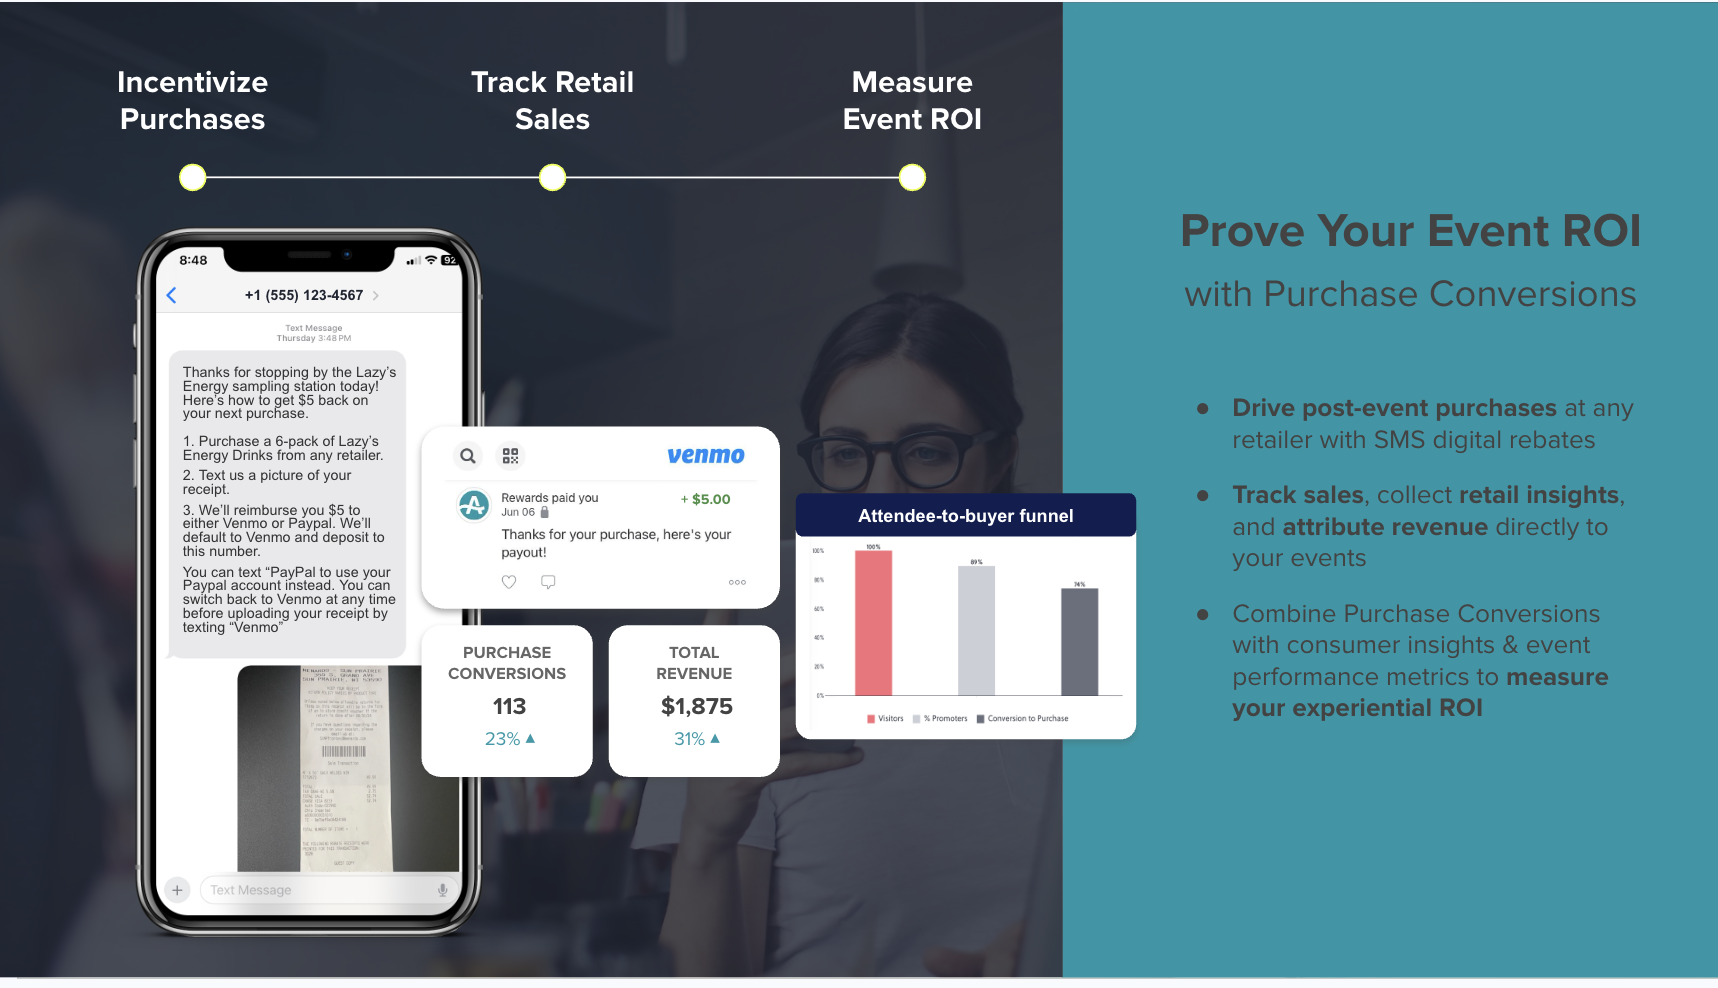
On-premise conversion becomes measurable in a way a depletion report never is. A rebate tied to an identifiable SKU on a bar tab, a Fireball line item for example, is a verified purchase tied to a known guest record. Receipt-verified cashback produces a verified purchase count by channel and by retailer rather than an estimate. The channel link still rests on the shopper’s interaction with the offer and the subsequent claim, so it does not by itself prove the activation caused the purchase or that the purchase was incremental. It also covers only shoppers who claim, so treat it as a complement to retailer and panel data, not a replacement.
In a one-month ambassador tasting pilot with a single unnamed craft brand on a small dataset, 56% of records collected converted to a bottle purchase. This is an early pilot result, not a platform benchmark.
AnyRoad also offers a sweepstakes variant: prize entry instead of cash back, with AnyRoad handling terms, conditions, and privacy compliance.
For CPG brands running field marketing events, AnyRoad data from Conversate Collective’s activations for a CPG beauty brand showed that 74% of guests were more likely to purchase the brand’s products after attending, and over 50% of surveyed consumers bought the brand’s products from Walgreens and Target. This demonstrates that purchase location data from receipt-verified mechanics can identify exactly which retail accounts an activation is driving.

For spirits brands running festival activations, an artisanal mezcal brand working with agency POPLIFE recorded 85% post-event purchase intent across its festival activations at III Points and Portola, using AnyRoad’s platform for data capture and follow-up measurement.
Prove Future Retail Sales Impact From Your Experiences. Book A Demo.
How To Prove Experiential Marketing ROI To Finance
A number that survives a finance review has four properties: a disclosed attribution window, a baseline set before the activation ran, a clear separation between traced and caused sales, and an honest statement of what the method can and cannot prove. A number that lacks any of these will be discounted, because the methodology cannot be audited.
The checklist for a defensible report:
- Choose and disclose the attribution window before the activation runs, set by the category’s purchase cycle.
- Set the baseline before the activation runs, not after you see the results.
- Report traced sales and caused sales separately and label which is which.
- Avoid overclaiming by treating a QR code scan as a trace rather than proof of causation.
- Flag vendor bias in any case study you present, including your own platform’s reported lift.
- Pre-register the holdout design and the decision rule before the campaign launches.
BCG research identifies the most common backlash after a first incrementality test as a challenge to the methodology, not the number itself, because program owners have a strong incentive to dispute a result that shows limited lift. Pre-registering the design and the decision rule removes that lever. The methodology is on record before anyone sees the outcome.
For a broader treatment of how to measure experiential marketing ROI and the full event marketing ROI calculation framework, those guides cover the revenue-side math in detail. This article focuses on which method produces the number rather than how to calculate it once you have it.
What A Defensible Number Unlocks
Once the attribution data clears a finance review, it does a second job. The same first-party records that attribute a sale also identify the guests most likely to enroll in a club or membership. A consumer who visits a distillery twice is 512% more likely to convert to a paid loyalty enrollment, according to AnyRoad’s own reporting. The visit becomes an acquisition signal.
AnyRoad reports that experience-driven opt-ins convert to paid loyalty at four times the rate of traditional channels, and member spending increases 150% within the first year. The attribution data that proves an activation sold bottles is the same data that identifies which guests are worth re-engaging and which are ready to be asked about a bottle club.
For the full picture on converting activation data into recurring revenue, see how to measure experiential marketing’s impact on sales and the best software to track and prove event marketing ROI.
AnyRoad Vs. The Alternatives
The platforms that show up most often for experiential attribution fall into two groups: measurement-only tools and booking or ticketing tools. Neither group closes the loop between running an activation and proving what it sold, and the difference shows up vendor by vendor.

- AnyRoad: Runs the experience and produces the first-party, receipt-verified purchase data needed to attribute sales to it.
- Makai: a 30-year experiential and retail activation partner for CPG and beverage brands. It runs multi-market demos, roadshows, and Costco or club programs, and positions itself around measuring real ROI from the live events it executes.
- PortMA: does not operate activations itself, but captures guest and consumer data at the point of experience through its Field Staff Tracking App, which brand ambassadors use onsite to check in, record consumer input, record event recap data, upload photos, and check out, with GPS and time stamps.
- FareHarbor: Handles booking management for tours and activities, with no post-experience purchase conversion tools and no analytics beyond booking and payment data.
- Eventbrite: A demand-generation and ticketing platform that co-owns consumer data and has no mechanism for connecting a ticket scan to a retail purchase.
- Tock: Handles reservations and ticketing for restaurants and wineries with limited post-experience engagement tools and no purchase attribution capability.
The documented trade-off is straightforward. If the question is “what did my activation sell,” a booking tool cannot answer it, and a measurement tool that did not run the activation cannot capture the first-party guest record needed to close the loop. AnyRoad captures the guest at registration, delivers the rebate via SMS, reads the receipt, and reports the verified purchase count, all within one platform and without POS integration from any retail or on-premise account.
For brands evaluating the full software landscape, the complete guide to event ROI tracking software covers the category in detail.
Conclusion: Separate, Match, Disclose, Defend
Attributing sales to experiential marketing is a discipline with four structural requirements: separate attributed from incremental sales, match the method to the activation type, disclose the attribution window and baseline before the campaign runs, and be honest about what the resulting number proves. Keep traced sales and caused sales in separate columns, treat a QR code scan as a trace rather than a test, and never present a depletion report as a verified purchase count.
AnyRoad is the best experiential marketing platform for attributing sales to experiential marketing because it is the only option that both runs the experience and produces the data needed to defend the number in a finance review.
How Are You Measuring ROI From Brand Activations? Book A Demo.
Frequently Asked Questions
What Is The Difference Between Attributed Sales And Incremental Sales In Experiential Marketing?
Attributed sales trace a purchase to an activation through an identifier, while incremental sales prove the purchase would not have happened otherwise. The opening section covers the distinction in full. The practical consequence for a finance conversation is that the incremental number is the smaller one, and it is the one worth defending.
Which Attribution Method Is Best For Alcohol Brand Activations At Third-Party Retail Accounts?
For ambassador tastings and sampling events inside retail accounts the brand does not own, receipt-verified rebates are the most practical method. The mechanic works without asking the retailer to share EPOS data or integrate a POS system. The consumer registers at the activation via QR code, receives an SMS with a cashback offer, photographs the receipt after purchase, and submits it for verification. The brand receives a verified purchase count tied to a known guest record across any retailer where the product is sold. This produces a traceable purchase signal that a depletion report cannot provide. Where budget and timeline allow, pairing receipt-verified tracing with a geo holdout in matched markets adds the causal layer and separates traced purchases from incremental ones.
How Do You Set An Attribution Window For An Experiential Marketing Campaign?
The attribution window should be set by the category’s purchase cycle, not by an arbitrary calendar period. For spirits and CPG beverages, a consumer who samples a product at an activation may not purchase for days or weeks, particularly if the category is considered rather than impulse. Set the window before the activation runs, document it in the measurement plan, and hold it fixed through reporting. Changing the window after seeing results is the fastest way to lose credibility with finance. For a matched-market or holdout design, the window also needs to account for the reporting lag in depletion data, which in beverage alcohol can run four to eight weeks. Shorter windows may capture noise rather than signal.
What Are The Limitations Of QR Codes And Promo Codes For Experiential Attribution?
QR codes and promo codes capture only the fraction of attendees who take an immediate, conscious action at or shortly after the activation. They systematically undercount the activation’s contribution because they miss purchases by consumers who experienced the activation, formed intent, and bought later without using a code. They also say nothing about whether the purchase was incremental. A consumer who was already planning to buy the product may scan a code and claim a rebate, appearing in the attributed data without representing a caused sale. QR and promo code data is useful as a tracing tool and as a first-party data capture mechanism, but it should be reported as traced sales rather than incremental sales and should be complemented with a holdout or control group design wherever the activation scale justifies the investment.
How Does AnyRoad Connect Experiential Activations To Retail Sales Without POS Integration?
AnyRoad’s receipt-verified rebate mechanic runs entirely on the consumer’s receipt, which means it works in any retail or on-premise account without requiring the retailer or bar to integrate any system. At the activation, guests register via QR code using the AnyRoad Live app. After the activation, they receive an SMS with a cashback rebate redeemable anywhere the product is sold. They purchase the bottle, photograph the receipt, and text it back. AnyRoad’s AI reads the receipt, confirms the eligible SKU, and pays out via Venmo or PayPal. The result is a verified purchase count tied to a first-party guest record across Total Wine, independent liquor stores, and on-premise bar accounts alike. A sweepstakes variant runs the same mechanic with a prize entry instead of cash back, with AnyRoad handling regulatory compliance including terms, conditions, and privacy policies.