


Written by: Bryan Grobstein, Vice President, Global Revenue, AnyRoad
Key Takeaways
Before diving into the details, review these core points about measuring shopper marketing ROI.
- Shopper marketing ROI measures incremental profit generated by a campaign relative to its total cost and isolates sales lift beyond organic performance.
- Revenue-based calculations inflate perceived return. Using contribution margin instead of revenue reveals the real profitability of campaigns.
- Three proven methods for determining incremental sales include test/control markets, pre/post analysis, and loyalty or panel data tracking.
- Accurate ROI depends on capturing all program costs, including creative, retailer fees, trade promotions, staffing, and logistics, not just direct media spend.
- AnyRoad connects activations to verified retail sales through receipt-verified cashback rebates and gamified purchase tools. See how AnyRoad measures true campaign ROI.
The Shopper Marketing ROI Formula: Focus On Incremental Profit
The core formula for shopper marketing ROI is straightforward.
ROI = (Incremental Profit − Total Program Cost) / Total Program Cost × 100
Where:
- Incremental Profit = (Incremental Sales × Unit Margin) − Incremental Costs (such as trade spend and retailer fees)
- Total Program Cost = All working and non-working costs
Revenue-based calculations overstate return. A campaign that drives $50,000 in incremental sales with a 30% margin generates $15,000 in incremental profit. If that campaign costs $10,000, the ROI is 50%. A revenue-based calculation would show 400% and mislead budget decisions. As Jim Lenskold, author of Marketing ROI, notes: “You really need margin because the financial people don't want you to spend money that just kind of brings in revenue.”
The most rigorous approach uses contribution margin, not just gross margin, to account for variable costs. A Fairview example shows how the same $25,000 spend with $100,000 attributed revenue yields +300% revenue ROI but -7.6% incremental contribution-margin ROI at 55% incrementality. A campaign that appears profitable on revenue can lose money on incremental profit. Bigeye Agency defines incremental profit as incremental sales multiplied by net contribution margin, which keeps the metric margin-aware rather than revenue-only.
How To Determine Incremental Sales: Methods And Best Practices
Incremental sales sit at the center of any credible ROI calculation. Without isolating the campaign's true effect, the ROI number becomes fiction. Three practical methods exist for establishing incremental lift.
Test/Control Markets
Test/control markets provide the gold standard for measuring incrementality. Select comparable stores or DMAs, run the campaign only in the test group, and compare sales lift against the control group. Keep the control group at 10–20% of the total audience and run the test for at least two to four weeks to capture a full purchase cycle. Calculate incremental lift as:
((Test Group Sales − Control Group Sales) / Control Group Sales) × 100
According to eMarketer, 71% of advertisers rank incrementality testing as the single most important KPI in retail and commerce media measurement. Geo-holdout testing offers the most credible method for retail media incrementality. These tests typically require four to eight weeks to reach statistical significance.
Pre/Post Analysis
Pre/post analysis compares sales before, during, and after the campaign in the same stores, with adjustments for seasonality and trends. Use a historical average of 8–12 weeks prior as your baseline. This method is simpler but noisier because seasonality, competitor moves, and market shifts can distort results. A Guidance worked example of a 4-week temporary price reduction shows that ignoring the post-promotion dip would have shown a 35% ROI, while the true trade promotion ROI was only +2.2%. This illustrates why adjusting for post-promotion effects is essential.
Loyalty Data And Panel Data
Loyalty card or consumer panel data tracks individual purchase behavior and enables more precise attribution of lift. A member of Bain's Advisor Network notes: “Being able to measure something is attribution. Understanding how it changes consumer behavior is incrementality.” Loyalty data shows which specific shoppers bought because of the campaign, rather than only aggregate store sales.
Experiential activations such as in-store tastings benefit from unique promo codes or QR codes that track conversions directly. AnyRoad's gamified purchase conversion tools use cashback rebates and sweepstakes tied to receipt-verified purchases to connect the activation to actual retail sell-through.

Calculating Total Program Cost
Total program cost determines whether a campaign truly pays back. Understating cost inflates ROI, so every component must be included.
- Creative development and production
- Retailer fees such as slotting, display fees, and end-cap rents
- Trade promotions including discounts, coupons, and scan-downs
- Staffing and ambassador labor, fully loaded with wages, training, and travel
- Agency or technology costs
- Logistics and permits
Trade spend alone typically runs 15–25% of gross revenue for CPG brands. To see why this matters, consider field labor. Field labor is the largest controllable line item in retail activation budgets and typically accounts for 50% to 70% of total event expense. A six-hour consumer-facing demo shift usually requires nine to ten paid hours per ambassador when setup, teardown, training, and travel are included.
When you add indirect costs, the picture shifts again. Fully loaded marketing cost is typically 1.5x to 2x direct media spend for most mid-sized teams, so reported ROI should be roughly halved if only ad spend is counted.
A simple cost breakdown example clarifies this. A 4-week display campaign might include $5,000 in display fees, $3,000 in promotional discounts, $1,500 in creative production, and $500 in staffing, for a $10,000 total program cost.
Supporting Metrics To Track Beyond ROI
ROI shows whether a campaign is profitable, but it does not explain why. These supporting metrics help diagnose performance and refine future campaigns.
- Conversion Rate: Percentage of shoppers exposed to the display or activation who make a purchase
- Cost Per Acquisition (CPA): Total program cost divided by number of new shoppers gained
- Basket Size: Average order value, which shows whether the campaign increased multi-item purchases
- Repeat Purchase Rate: Percentage of new customers who buy again within 90 days
Brands evaluating sampling ROI at the 7-day mark typically underreport actual ROI by 40–60%. Tracking through a full 90-day window captures complete business impact, including delayed first purchases and repeat purchase lift.
Benchmarks: Defining A “Good” Shopper Marketing ROI
Benchmarks for shopper marketing ROI vary by category, channel, and time horizon. A positive ROI means the campaign generated more profit than it cost. Across 182 brands, the median profit ROI for retail media was 1.44, with Kroger at 2.31 and Target Roundel at 1.93. Most CPG brands target 20–50% ROI on trade promotions, meaning every dollar of trade spend generates $1.20–$1.50 in incremental gross profit. Treat these figures as directional references. Your category, margin structure, and campaign objectives define what “good” looks like for your brand.
Common Mistakes And How To Avoid Them
- Ignoring Baseline Sales: Without a baseline, you measure total sales instead of incremental lift. Establish a baseline before launch using historical averages or control groups. This foundation supports every other step in isolating incrementality.
- Failing To Isolate Incrementality: Even with a baseline, relying only on platform metrics can mislead. Platform-reported ROAS often overstates true return by a similar magnitude to the underreporting cited earlier (per Bigeye), while other sources such as Fairview cite a wider 1.5x–3x overstatement. Run holdout tests or use loyalty data to measure causal lift.
- Forgetting Retailer Costs: Display and ad fees pay for visibility such as endcaps and circular features and are usually fixed-fee. A brand may pay $4,000 for an endcap regardless of how many units move. Include all trade spend in your cost calculation.
- Using The Wrong Margin: A campaign generating $100,000 in revenue with a 20% margin yields $20,000 in actual return. Campaigns showing 500% ROI on revenue can be break-even on margin. Use contribution margin or gross margin instead of revenue.
- Missing Long-Term Effects: Some promotional mechanics generate customer relationships that deliver value beyond the campaign window. Track through a 90-day window to capture delayed and repeat purchases.
Worked Example: Applying The Incremental Profit Framework
This example shows how the Incremental Profit Framework works in practice. A beverage brand runs a 4-week in-store display and sampling campaign in 50 stores.
The Numbers:
- Baseline weekly sales per store: $2,000
- Total baseline sales (50 stores × 4 weeks): $400,000
- Actual sales during campaign: $460,000
- Incremental sales: $60,000 (15% lift)
- Unit margin: 30%
- Incremental profit: $18,000
- Total program cost: $10,000 (display fees, sampling labor, product, logistics)
The Calculation:
- Incremental Sales = $460,000 − $400,000 = $60,000
- Incremental Profit = $60,000 × 30% = $18,000
- ROI = ($18,000 − $10,000) / $10,000 × 100 = 80%
Get the shopper marketing ROI Excel template to run your own calculations with AnyRoad's team.
How AnyRoad Closes The Loop Between Activations And Retail Sales
Calculating ROI on paper only works when you can connect experiences to verified purchases. AnyRoad's experiential marketing platform closes this loop, especially for in-store tastings and brand events where traditional measurement produces only a depletion report.

AnyRoad's gamified purchase conversion tools, including cashback rebates and sweepstakes, track receipt-verified purchases. After a consumer registers at an activation, they receive an SMS with a cashback rebate redeemable anywhere the product is sold. They buy the bottle, photograph the receipt, and text it back. AnyRoad's AI reads the receipt, confirms the eligible SKU, and pays the rebate via Venmo or PayPal. No POS integration is required.
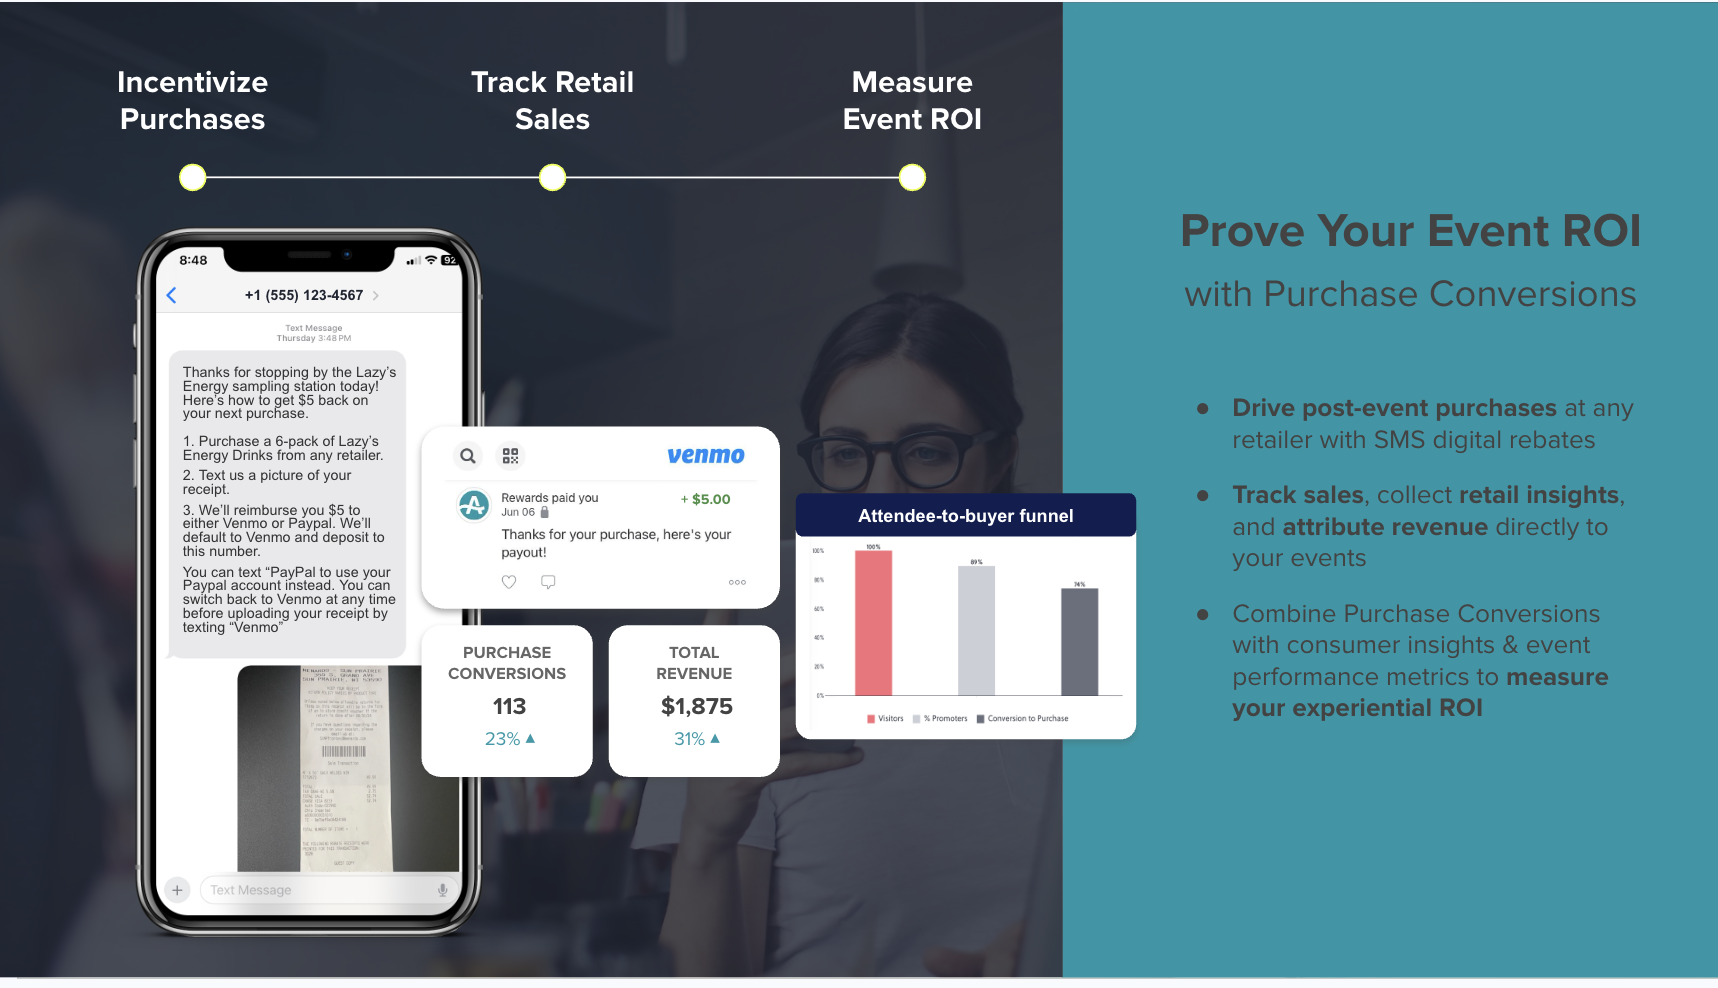
In a one-month ambassador tasting pilot with a craft brand, 56% of the records collected converted to a bottle purchase. This early, small-sample pilot result illustrates the mechanic's potential for connecting experiential spend to retail sell-through. AnyRoad also captures first-party consumer data and provides AI-powered insights through PinPoint to measure brand affinity and purchase intent. Together, these capabilities give you a complete picture from experience to purchase.

See how AnyRoad connects your activations to retail sales.
Frequently Asked Questions
What Is A Good ROI For Shopper Marketing?
A positive ROI means the campaign generated more profit than it cost to run. As noted in the benchmarks section, many CPG brands target a similar range for trade promotions, and retail media benchmarks show a median profit ROI around that level (see above). What constitutes “good” depends on your category, margin structure, and campaign objective. A display campaign for a high-margin premium beverage has a different hurdle rate than a scan-down promotion for a commodity grocery item. Use industry benchmarks as directional references, establish your own historical baseline, and evaluate each campaign against the opportunity cost of alternative uses of that budget.
How Do I Measure Incremental Sales Lift?
Three methods are available, each with different levels of rigor. Test/control market design, which withholds the campaign from 10–20% of comparable stores and compares sales over a two-to-four-week window, serves as the gold standard. Pre/post analysis compares sales against an 8–12 week historical baseline in the same stores and adjusts for seasonality. This method is simpler but more susceptible to external noise. Loyalty card or panel data tracks individual purchase behavior and allows you to attribute lift to specific shoppers rather than aggregate store-level sales. For experiential activations, unique promo codes, QR codes, or receipt-verified rebate mechanics provide a direct conversion record that complements these methods.
What Is The Difference Between Shopper Marketing ROI And Overall Marketing ROI?
Shopper marketing ROI focuses specifically on in-store activations, displays, trade promotions, and retail media at or near the point of purchase. Overall marketing ROI encompasses all channels, including digital, broadcast, experiential, and trade, typically measured at the brand or portfolio level. Shopper marketing ROI requires isolating incremental lift at the store or market level, which presents unique measurement challenges. Retailer-reported data varies by attribution model, trade spend compresses margins in ways that do not appear in top-line revenue, and in-store activations historically produced only depletion reports rather than verified purchase records. The Incremental Profit Framework addresses these challenges by anchoring measurement to margin-adjusted, causally isolated lift rather than attributed revenue.
How Can I Measure ROI For In-Store Tastings Or Events?
In-store tastings and experiential activations have historically been the hardest shopper marketing tactics to measure because they occur at third-party retail locations without POS integration. The most practical approach uses unique promo codes or QR codes at the point of registration to create a first-party record of every consumer who engages with the activation. From there, a cashback rebate mechanic, where the consumer purchases the product, photographs the receipt, and submits it for verification, creates a receipt-verified record of the sale. As described earlier, AnyRoad's platform automates the entire rebate flow from registration to payment. This produces the incremental sales data needed to calculate a defensible ROI without requiring any retailer POS integration.
What Costs Are Commonly Missed In Shopper Marketing ROI Calculations?
The most frequently omitted costs are retailer fees, post-promotion dips, and fully loaded labor. Slotting fees, display fees, and end-cap rents are fixed commitments that accrue regardless of sales outcome and must be included in total program cost. Scan-downs and promotional allowances scale with volume but are often tracked separately from the campaign budget, which causes them to be excluded from ROI calculations. On the labor side, a six-hour ambassador shift typically requires nine to ten paid hours when setup, teardown, training, and travel are included, so using only the consumer-facing hours understates cost significantly. Finally, post-promotion dips, the sales decline that follows a temporary price reduction as pantry-loaded consumers delay their next purchase, reduce true incremental lift and must be accounted for in the baseline adjustment.
Conclusion: Build A Framework For Shopper Marketing ROI
Measuring retail shopper marketing ROI means building a framework that isolates incremental profit, accounts for all costs, and drives better budget decisions, not chasing a single number. Start with the Incremental Profit Framework. Define your baseline, run test/control or pre/post analysis, track all program costs, and use supporting metrics to diagnose performance. Platform-reported ROAS and depletion reports provide a starting point, while your framework delivers the finish line.
Ready to prove future retail sales impact from your experiences? Talk to AnyRoad.